16 KiB

![]()
Tables and Graphs
Console Table and Graph/Plot Libraries
Copyright © 2018 Teal Dulcet
These header only libraries use box-drawing, Braille, fraction and other Unicode characters and terminal colors and formatting to output tables and graphs/plots to the console. All the tables and graphs are created with a single (one) function call and they do not require any special data structures.
See the python directory for Python ports of the libraries.
❤️ Please visit tealdulcet.com to support these libraries and my other software development.
Tables
Usage
Requires support for C++17. See the tables.hpp file for full usage information.
Complete versions of all of the examples below and more can be found in the tables.cpp file.
Compile with:
GCC: g++ -std=c++17 -Wall -g -O3 tables.cpp -o tables
Clang: clang++ -std=c++17 -Wall -g -O3 tables.cpp -o tables
Run with: ./tables
Output char array as table
C style char array
#include "tables.hpp"

using namespace std;

int main()
{
	size_t rows = 5;
	size_t columns = 5;

	char ***array;

	// Allocate and set array

	tables::options aoptions;
	aoptions.headerrow = true;
	aoptions.headercolumn = true;

	tables::array(rows, columns, array, nullptr, nullptr, aoptions);

	// Deallocate array

	return 0;
}
C++ string array
#include "tables.hpp"

using namespace std;

int main()
{
	size_t rows = 5;
	size_t columns = 5;

	vector<vector<string>> array(rows, vector<string>(columns));

	// Set array

	string *headerrow = nullptr;
	string *headercolumn = nullptr;

	tables::options aoptions;
	aoptions.headerrow = true;
	aoptions.headercolumn = true;

	tables::array(array, headerrow, headercolumn, aoptions);

	return 0;
}
Table cells can contain Unicode characters, but not newlines and tabs.

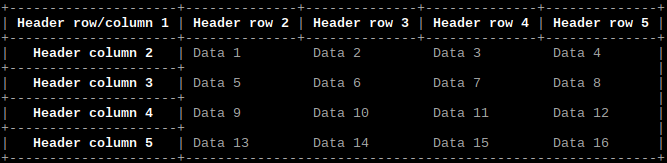
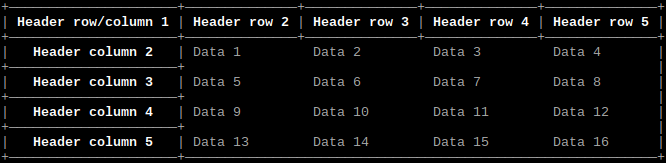
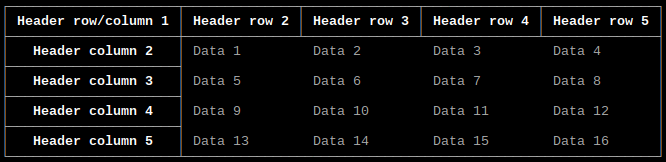
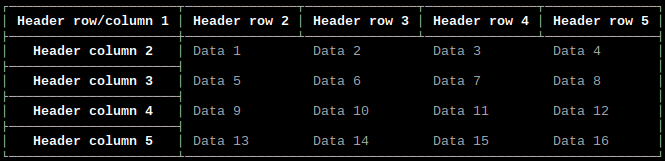
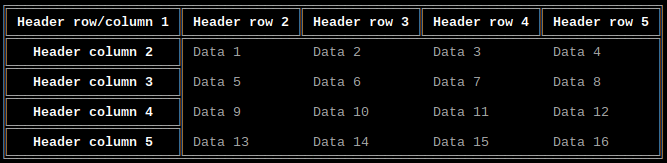
Output array as table with separate header row and column
C style char array
#include "tables.hpp"

using namespace std;

int main()
{
	size_t rows = 4;
	size_t columns = 4;

	const char* headerrow[] = {"Header row/column 1", "Header row 2", "Header row 3", "Header row 4", "Header row 5"};
	const char* headercolumn[] = {"Header column 2", "Header column 3", "Header column 4", "Header column 5"};

	char ***array;

	// Allocate and set array

	tables::options aoptions;
	aoptions.headerrow = true;
	aoptions.headercolumn = true;

	tables::array(rows, columns, array, headerrow, headercolumn, aoptions);

	// Deallocate array

	return 0;
}
C++ string array
#include "tables.hpp"

using namespace std;

int main()
{
	size_t rows = 5;
	size_t columns = 5;

	string headerrow[] = {"Header row/column 1", "Header row 2", "Header row 3", "Header row 4", "Header row 5"};
	string headercolumn[] = {"Header column 2", "Header column 3", "Header column 4", "Header column 5"};

	vector<vector<string>> array(rows, vector<string>(columns));

	// Set array

	tables::options aoptions;
	aoptions.headerrow = true;
	aoptions.headercolumn = true;
	// or with C++20:
	// tables::options aoptions{.headerrow = true, .headercolumn = true};

	tables::array(array, headerrow, headercolumn, aoptions);

	return 0;
}
Output same as example above.
Output array as table
C style pointer
#include "tables.hpp"

using namespace std;

int main()
{
	size_t rows = 5;
	size_t columns = 5;

	double **array; // array can be any data type

	// Allocate and set array

	tables::array(rows, columns, array);

	// Deallocate array

	return 0;
}
C++ array/vector
#include "tables.hpp"

using namespace std;

int main()
{
	size_t rows = 5;
	size_t columns = 5;

	vector<vector<double>> array(rows, vector<double>(columns)); // array can be any data type

	// Set array

	tables::array(array);

	return 0;
}

Output sorted array as table
C style pointer
#include <algorithm>
#include "tables.hpp"

using namespace std;

int dimensions; // Number of columns
int sortdimension; // Column to sort by

template <typename T>
bool compare(const T &a, const T &b)
{
	if (a[sortdimension] == b[sortdimension])
		for (int i = 0; i < dimensions; ++i)
			if (sortdimension != i and a[i] != b[i])
				return a[i] < b[i];

	return a[sortdimension] < b[sortdimension];
}

int main()
{
	size_t rows = 5;
	size_t columns = 5;

	int **array; // array can be any data type

	// Allocate and set array

	dimensions = columns;
	sortdimension = 0;

	sort(array, array + rows, compare<int *>);

	tables::array(rows, columns, array);

	// Deallocate array

	return 0;
}
C++ array/vector
#include <algorithm>
#include "tables.hpp"

using namespace std;

int sortdimension; // Column to sort by

template <typename T>
bool compare(const T &a, const T &b)
{
	if (a[sortdimension] == b[sortdimension])
		for (int i = 0; i < size(a); ++i)
			if (sortdimension != i and a[i] != b[i])
				return a[i] < b[i];

	return a[sortdimension] < b[sortdimension];
}

int main()
{
	size_t rows = 5;
	size_t columns = 5;

	vector<vector<int>> array(rows, vector<int>(columns)); // array can be any data type

	// Set array

	sortdimension = 0;

	sort(array.begin(), array.end(), compare<vector<int>>);

	tables::array(array);

	return 0;
}

Output single function as table
C style function pointer
#include "tables.hpp"

using namespace std;

double afunction(double x)
{
	return x + 1;
}

int main()
{
	double xmin = -10;
	double xmax = 10;
	double xscl = 2;

	tables::options aoptions;
	aoptions.headerrow = true;

	tables::function(xmin, xmax, xscl, afunction, aoptions);

	return 0;
}
C++ lambda function
#include "tables.hpp"

using namespace std;

int main()
{
	double xmin = -10;
	double xmax = 10;
	double xscl = 2;

	function<double(double)> afunction = [](auto x)
	{ return x + 1; };

	tables::options aoptions;
	aoptions.headerrow = true;

	tables::function(xmin, xmax, xscl, afunction, aoptions);

	return 0;
}

Output multiple functions as table
C style function pointer
#include <cmath>
#include "tables.hpp"

using namespace std;

double function1(double x)
{
	return 2 * x;
}

double function2(double x)
{
	return pow(x, 2);
}

int main()
{
	double xmin = -10;
	double xmax = 10;
	double xscl = 2;

	size_t numfunctions = 2;

	// Function parameter and return value can be any data type, as long as they are the same
	function<double(double)> functions[] = {function1, function2};

	tables::options aoptions;
	aoptions.headerrow = true;

	tables::functions(xmin, xmax, xscl, numfunctions, functions, aoptions);

	return 0;
}
C++ lambda function
#include <cmath>
#include "tables.hpp"

using namespace std;

int main()
{
	double xmin = -10;
	double xmax = 10;
	double xscl = 2;

	size_t numfunctions = 2;

	// Function parameter and return value can be any data type, as long as they are the same
	function<double(double)> functions[] = {[](auto x)
											{ return 2 * x; },
											[](auto x)
											{ return pow(x, 2); }};

	tables::options aoptions;
	aoptions.headerrow = true;

	tables::functions(xmin, xmax, xscl, numfunctions, functions, aoptions);

	return 0;
}

Options
Header row
Option: headerrow
Default value: false
Header rows are bolded, centered and have a border.
Header column
Option: headercolumn
Default value: false
Header columns are bolded, centered and have a border.
Table border
Option: tableborder
Default value: true
Cell border
Option: cellborder
Default value: false
Cell padding
Option: padding
Default value: 1
Alignment
Option: alignment
Values:
left(default)right
bool to alpha
Option: boolalpha
Default value: false
Title
Option: title
Default value: nullptr
The title is word wrapped based on the current width of the terminal, using this solution. Handles newlines, tabs and Unicode characters.
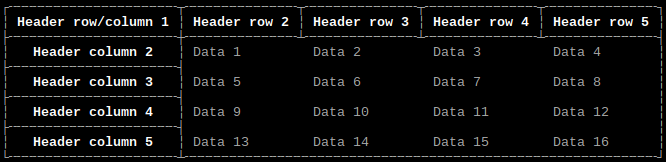
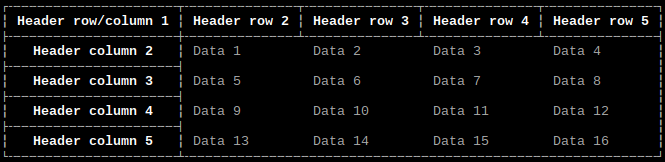
Border style
Option: style
Values:
-
ASCII
-
Basic
-
Light (default)
-
Heavy
-
Double
-
Light Dashed
-
Heavy Dashed


Other C++ Console Tables Libraries
- C++ Text Table (must specify every cell individually in their data structure, limited options, no Unicode support, no header row or column support)
- Cpp Console Table (must specify every cell individually in their data structure, no Unicode support, no header row or column support)
- ConsoleTable (requires C++11, must specify entire row at once in their data structure, no header column support)
Graphs/Plots
Usage
Requires support for C++17. See the graphs.hpp file for full usage information.
Complete versions of all of the examples below and more can be found in the graphs.cpp file.
Compile with:
GCC: g++ -std=c++17 -Wall -g -O3 graphs.cpp -o graphs
Clang: clang++ -std=c++17 -Wall -g -O3 graphs.cpp -o graphs
Run with: ./graphs
If height is 0, it will be set to the current height of the terminal (number of rows times four). If width is 0, it will be set to the current width of the terminal (number of columns times two).
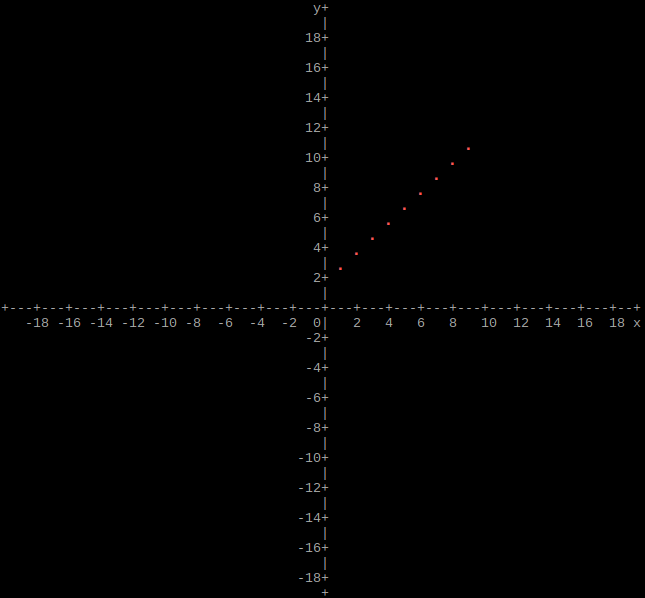
Output single array as plot
C style pointer
#include "graphs.hpp"

using namespace std;

int main()
{
	size_t height = 160;
	size_t width = 160;

	long double xmin = -20;
	long double xmax = 20;
	long double ymin = -20;
	long double ymax = 20;

	size_t rows = 10;

	double **array; // array can be any data type, but must have exactly two columns

	// Allocate and set array

	graphs::array(height, width, xmin, xmax, ymin, ymax, rows, array);

	// Deallocate array

	return 0;
}
C++ array/vector
#include "graphs.hpp"

using namespace std;

int main()
{
	size_t height = 160;
	size_t width = 160;

	long double xmin = -20;
	long double xmax = 20;
	long double ymin = -20;
	long double ymax = 20;

	size_t rows = 10;

	vector<vector<double>> array(rows, vector<double>(2)); // array can be any data type, but must have exactly two columns

	// Set array

	graphs::array(height, width, xmin, xmax, ymin, ymax, array);

	return 0;
}
If xmin and xmax are both 0, they will be set to the respective minimum and maximum values of x in the array. If ymin and ymax are both 0, they will be set to the respective minimum and maximum values of y in the array.

Use graphs::arrays() to plot multiple arrays, which can be of different sizes.
Output single function as graph
C style function pointer
#include "graphs.hpp"

using namespace std;

double afunction(double x)
{
	return x + 1;
}

int main()
{
	size_t height = 160;
	size_t width = 160;

	long double xmin = -20;
	long double xmax = 20;
	long double ymin = -20;
	long double ymax = 20;

	graphs::function(height, width, xmin, xmax, ymin, ymax, afunction);

	return 0;
}
C++ lambda function
#include "graphs.hpp"

using namespace std;

int main()
{
	size_t height = 160;
	size_t width = 160;

	long double xmin = -20;
	long double xmax = 20;
	long double ymin = -20;
	long double ymax = 20;

	function<double(double)> afunction = [](auto x)
	{ return x + 1; };

	graphs::function(height, width, xmin, xmax, ymin, ymax, afunction);

	return 0;
}

Output multiple functions as graph
C style function pointer
#include "graphs.hpp"

using namespace std;

double function1(double x)
{
	return 2 * x;
}

double function2(double x)
{
	return pow(x, 2);
}

int main()
{
	size_t height = 160;
	size_t width = 160;

	long double xmin = -20;
	long double xmax = 20;
	long double ymin = -20;
	long double ymax = 20;

	size_t numfunctions = 2;

	// Function parameter and return value can be any data type, as long as they are the same
	function<double(double)> functions[] = {function1, function2};

	graphs::functions(height, width, xmin, xmax, ymin, ymax, numfunctions, functions);

	return 0;
}
C++ lambda function
#include "graphs.hpp"

using namespace std;

int main()
{
	size_t height = 160;
	size_t width = 160;

	long double xmin = -20;
	long double xmax = 20;
	long double ymin = -20;
	long double ymax = 20;

	size_t numfunctions = 2;

	// Function parameter and return value can be any data type, as long as they are the same
	function<double(double)> functions[] = {[](auto x)
											{ return 2 * x; },
											[](auto x)
											{ return pow(x, 2); }};

	graphs::functions(height, width, xmin, xmax, ymin, ymax, numfunctions, functions);

	return 0;
}

Options
Border/Axis
Option: border
Default value: true
Axis labels
Option: axislabel
Default value: true
Requires border to be true.
Axis units labels
Option: axisunitslabel
Default value: true
Requires border and axislabel to be true.
Title
Option: title
Default value: nullptr
The title is word wrapped based on the current width of the terminal, using this solution. Handles newlines, tabs and Unicode characters.
Axis/Border style
Option: style
Values:
-
ASCII
-
Basic

-
Light (default)
-
Heavy

-
Double
-
Light Dashed

-
Heavy Dashed


Graph/Plot Color
Option: color
Values:
- System default
- Black
- Red (default)
- Green
- Yellow
- Blue
- Cyan
- Light gray
- Dark gray
- Light red
- Light green
- Light yellow
- Light blue
- Light cyan
- White
See here for examples of the colors.
Only used for plots and when graphing a single function.
When graphing multiple functions, colors 2 - 14 are used inorder. Color 0 is used where the functions cross.
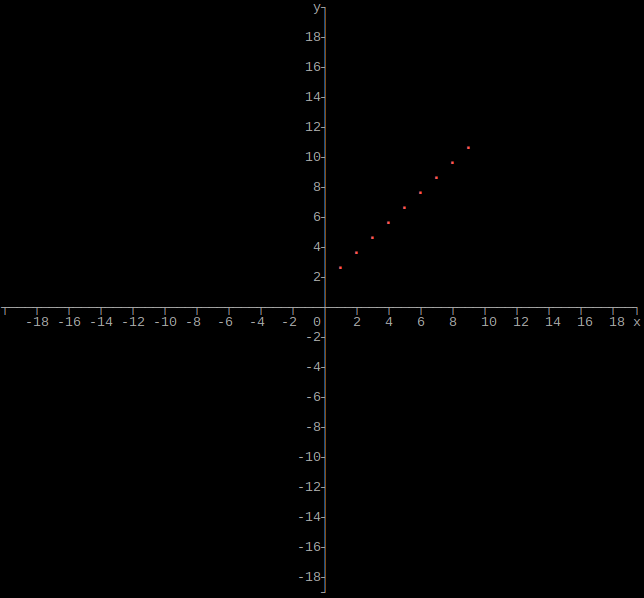
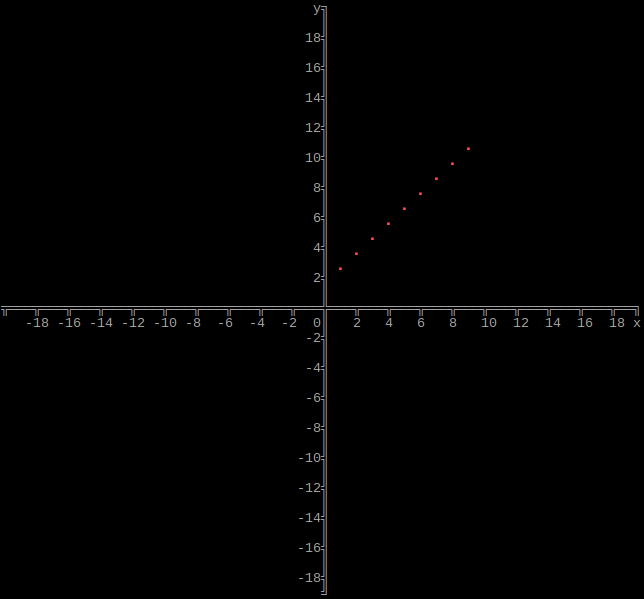
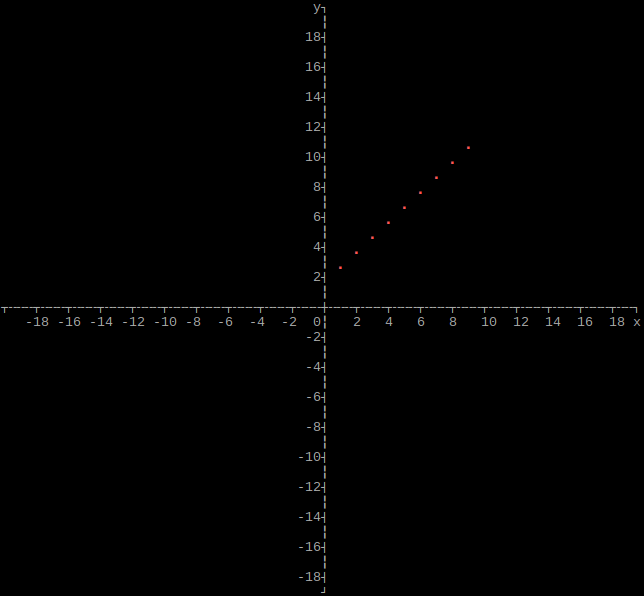
Plot

Graph

Other C++ Console Graphs/Plots Libraries
- C++ terminal plotting library (requires C++14, based on UnicodePlots.jl, no documentation and very difficult to use, although supports animations)
Contributing
Pull requests welcome! Ideas for contributions:
Both:
- Add more options
- Add an option to print a border around graphs/plots
- Add options to word wrap and truncate long text in table cells
- Add option to center text in table cells
- Add more examples
- Improve the performance
- Handle newlines and tabs in the tables
- Handle formatted text in the table and graph/plot titles
- Support more graph/plot colors
- Support 24-bit color
- Support combining colors when functions cross
- Update the
-t, --tableoptions of column command from util-linux to use the Table library - Create a new CLI tool that uses the Graph library
- Port to other languages (C, Java, Rust, etc.)
C++:
- Support tables with the
wchar_t,char16_tandchar32_tC data types and thewstring,u16stringandu32stringC++ data types.