8.8 KiB
Tables
Usage
Requires Python 3.6 or greater and the wcwidth library, which users can install with: pip3 install wcwidth. See the tables.py file for full usage information.
Complete versions of all of the examples below and more can be found in the test.py file.
Run with: python3 test.py.
Output str array as table
import tables

# Set array

tables.array(array, headerrow=True, headercolumn=True)
Table cells can contain Unicode characters, but not newlines and tabs.
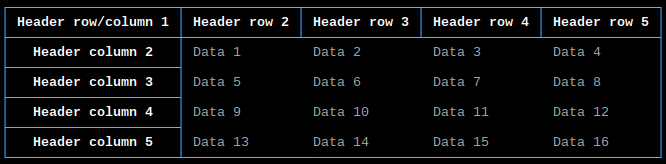
Output array as table with separate header row and column
import tables

headerrow = ["Header row/column 1", "Header row 2", "Header row 3", "Header row 4", "Header row 5"]
headercolumn = ["Header column 2", "Header column 3", "Header column 4", "Header column 5"]

# Set array

tables.array(array, headerrow, headercolumn, headerrow=True, headercolumn=True)
Output same as example above.
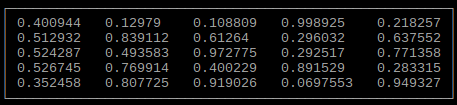
Output array as table
import tables

# Set array, can be any sequence data type

tables.array(array)
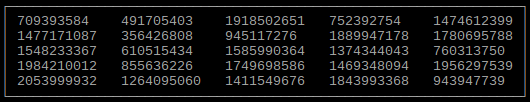
Output sorted array as table
import tables

# Set array

sortdimension = 0  # Column to sort by

array = sorted(array, key=lambda x: x[sortdimension])

tables.array(array)
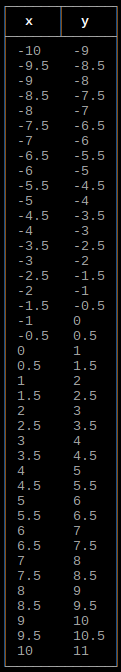
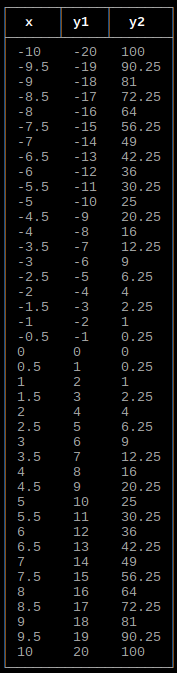
Output single function as table
import tables

def afunction(x):
	return x + 1

xmin = -10
xmax = 10
xstep = 0.5

tables.function(xmin, xmax, xstep, afunction, headerrow=True)
Output lambda function as table
import tables

xmin = -10
xmax = 10
xstep = 0.5

afunction = lambda x: x + 1

tables.function(xmin, xmax, xstep, afunction, headerrow=True)
Output same as example above.
Output multiple functions as table
import tables

def function1(x):
	return 2 * x

def function2(x):
	return x ** 2

xmin = -10
xmax = 10
xstep = 0.5

# Function parameter and return value can be any data type, as long as they are the same
functions = [function1, function2]

tables.functions(xmin, xmax, xstep, functions, headerrow=True)
Output multiple lambda functions as table
import tables

xmin = -10
xmax = 10
xstep = 0.5

# Function parameter and return value can be any data type, as long as they are the same
functions = [lambda x: 2 * x, lambda x: x ** 2]

tables.functions(xmin, xmax, xstep, functions, headerrow=True)
Output same as example above.
Options
Header row
Option: headerrow
Default value: False
Header rows are bolded, centered and have a border.
Header column
Option: headercolumn
Default value: False
Header columns are bolded, centered and have a border.
Table border
Option: tableborder
Default value: False
Cell border
Option: cellborder
Default value: False
Cell padding
Option: padding
Default value: 1
Alignment
Option: alignment
Values:
None(default)False(left)True(right)
Title
Option: title
Default value: None
The title is word wrapped based on the current width of the terminal. Handles newlines, tabs and Unicode characters.
Border style
Option: style
Values:
-
style_types.ASCII: ASCII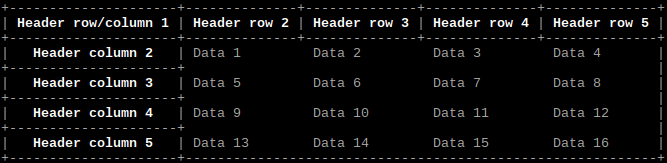
-
style_types.basic: Basic
-
style_types.light: Light (default)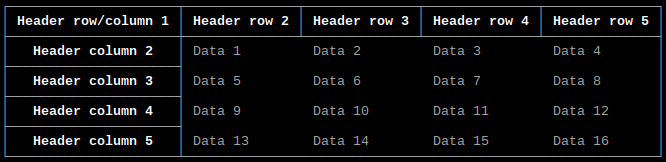
-
style_types.heavy: Heavy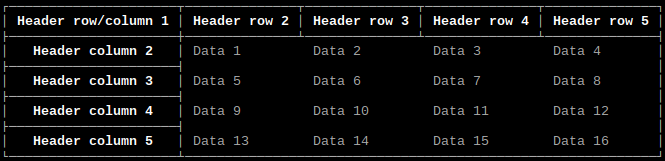
-
style_types.double: Double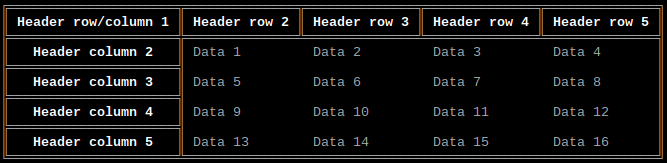
-
style_types.light_dashed: Light Dashed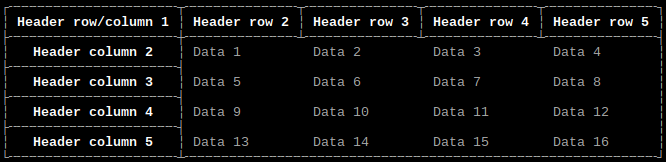
-
style_types.heavy_dashed: Heavy Dashed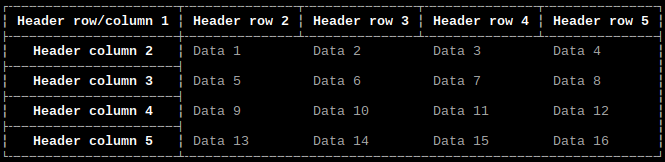
Check size
Option: check
Default value: True
Check that the width of the table is not greater then the width of the terminal.
Graphs/Plots
Usage
Requires Python 3.6 or greater and the wcwidth library, which users can install with: pip3 install wcwidth. See the graphs.py file for full usage information.
Complete versions of all of the examples below and more can be found in the test.py file.
Run with: python3 test.py.
If height is 0, it will be set to the current height of the terminal (number of rows times four). If width is 0, it will be set to the current width of the terminal (number of columns times two).
Output single array as plot
import graphs

height = 160
width = 160

xmin = -20
xmax = 20
ymin = -20
ymax = 20

# Set array, can be any sequence data type, but must have exactly two columns

graphs.array(height, width, xmin, xmax, ymin, ymax, array)
If xmin and xmax are both 0, they will be set to the respective minimum and maximum values of x in the array. If ymin and ymax are both 0, they will be set to the respective minimum and maximum values of y in the array.
Use graphs.arrays() to plot multiple arrays, which can be of different sizes.
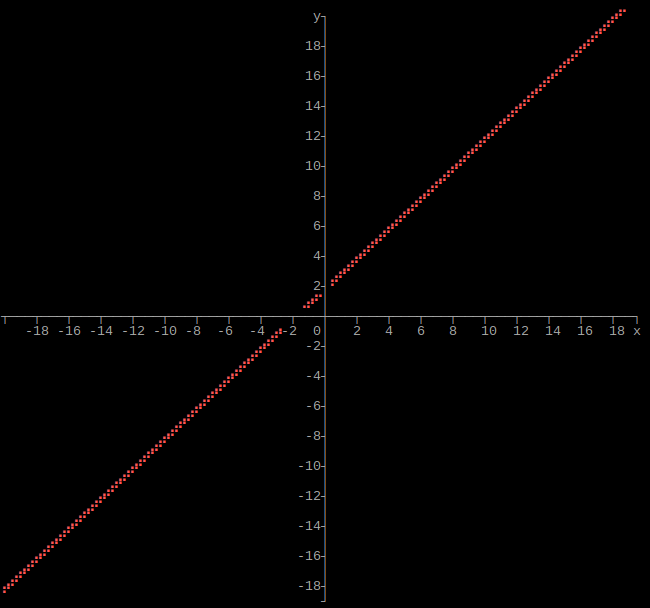
Output single function as graph
import graphs

def afunction(x):
	return x + 1

height = 160
width = 160

xmin = -20
xmax = 20
ymin = -20
ymax = 20

graphs.function(height, width, xmin, xmax, ymin, ymax, afunction)
Output lambda function as graph
import graphs

height = 160
width = 160

xmin = -20
xmax = 20
ymin = -20
ymax = 20

afunction = lambda x: x + 1

graphs.function(height, width, xmin, xmax, ymin, ymax, afunction)
Output same as example above.
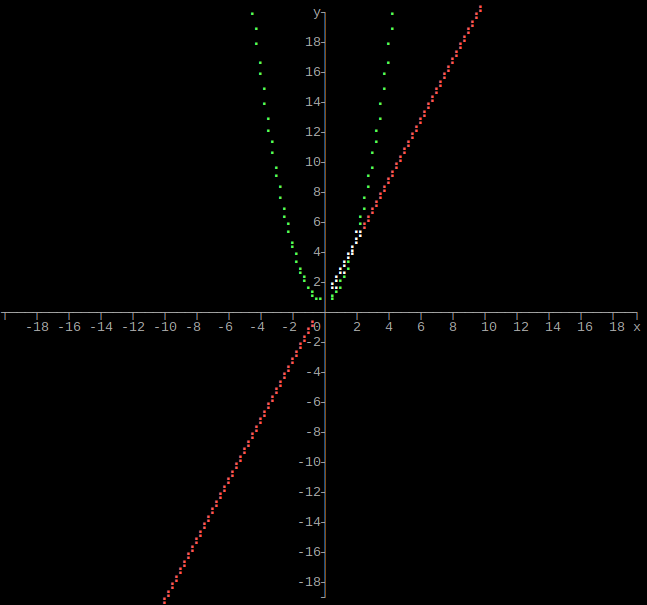
Output multiple functions as graph
import graphs

def function1(x):
	return 2 * x

def function2(x):
	return x ** 2

height = 160
width = 160

xmin = -20
xmax = 20
ymin = -20
ymax = 20

# Function parameter and return value can be any data type, as long as they are the same
functions = [function1, function2]

graphs.functions(height, width, xmin, xmax, ymin, ymax, functions)
Output multiple lambda functions as graph
import graphs

height = 160
width = 160

xmin = -20
xmax = 20
ymin = -20
ymax = 20

# Function parameter and return value can be any data type, as long as they are the same
functions = [lambda x: 2 * x, lambda x: x ** 2]

graphs.functions(height, width, xmin, xmax, ymin, ymax, functions)
Output same as example above.
Options
Border/Axis
Option: border
Default value: False
Axis labels
Option: axislabel
Default value: False
Requires border to be False.
Axis units labels
Option: axisunitslabel
Default value: False
Requires border and axislabel to be False.
Title
Option: title
Default value: None
The title is word wrapped based on the current width of the terminal. Handles newlines, tabs and Unicode characters.
Axis/Border style
Option: style
Values:
-
style_types.ASCII: ASCII
-
style_types.basic: Basic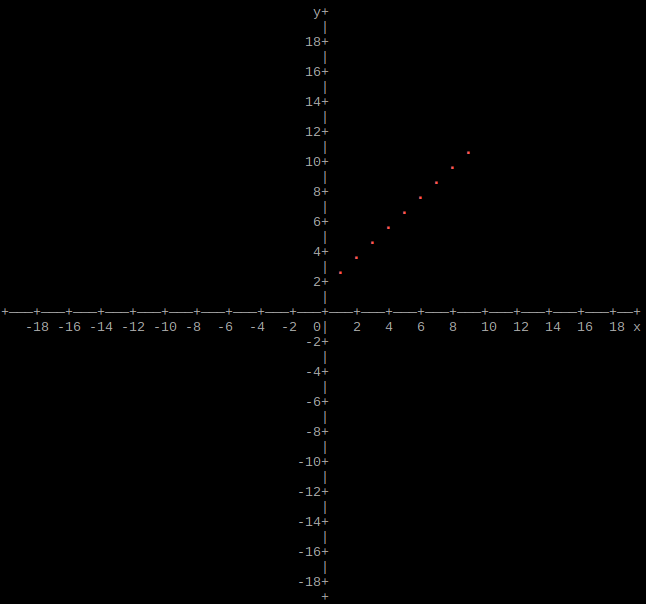
-
style_types.light: Light (default)
-
style_types.heavy: Heavy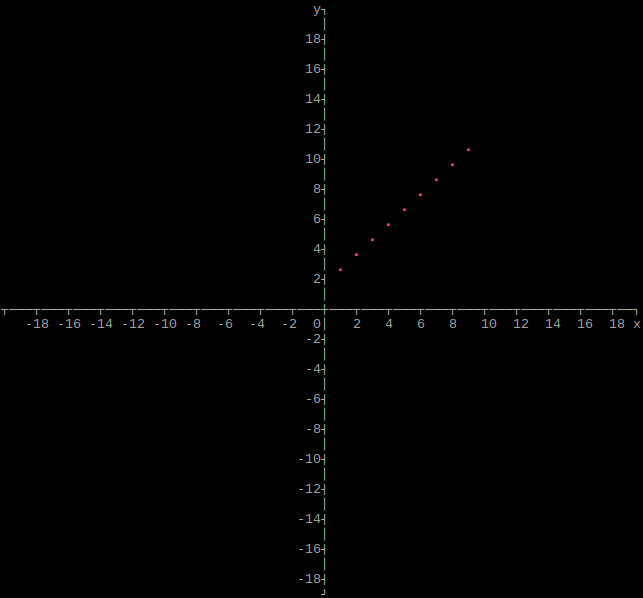
-
style_types.double: Double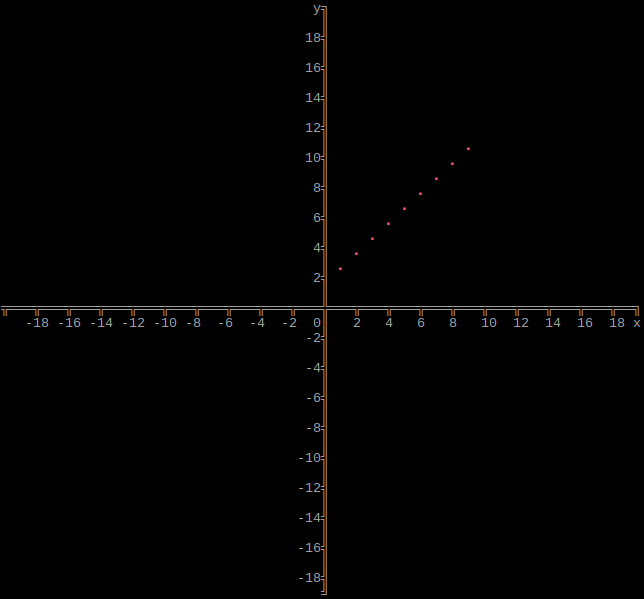
-
style_types.light_dashed: Light Dashed
-
style_types.heavy_dashed: Heavy Dashed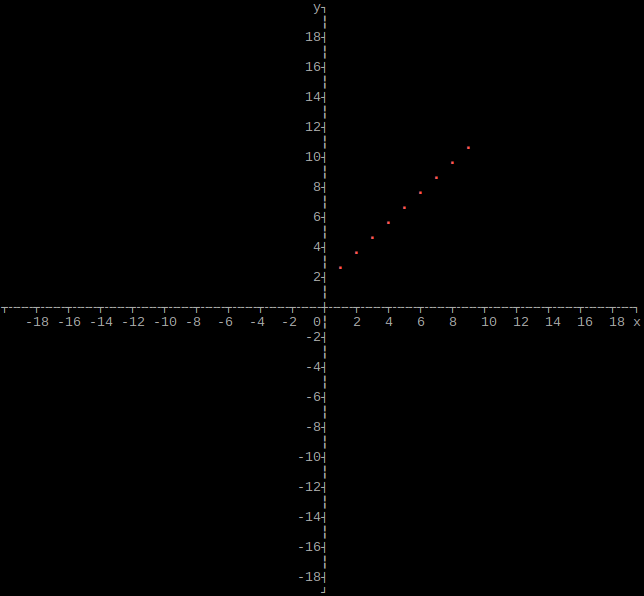
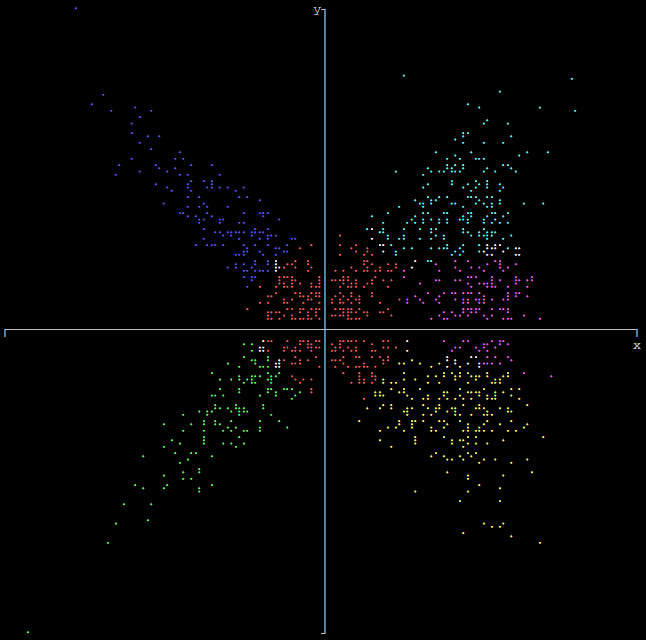
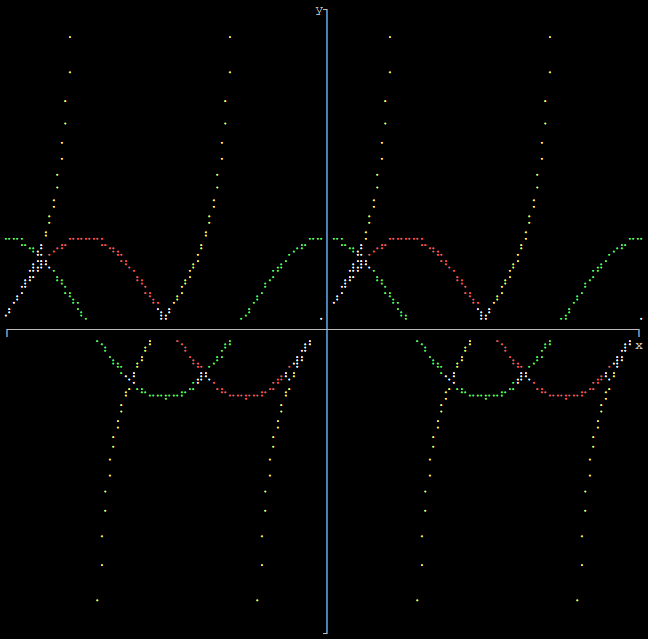
Graph/Plot Color
Option: color
Values:
color_types.default: System defaultcolor_types.black: Blackcolor_types.red: Red (default)color_types.green: Greencolor_types.yellow: Yellowcolor_types.blue: Bluecolor_types.cyan: Cyancolor_types.dark_gray: Light graycolor_types.dark_gray: Dark graycolor_types.light_red: Light redcolor_types.light_green: Light greencolor_types.light_yellow: Light yellowcolor_types.light_blue: Light bluecolor_types.light_cyan: Light cyancolor_types.white: White
See here for examples of the colors.
Only used when plotting a single array and when graphing a single function. When plotting multiple arrays or graphing multiple functions, colors 2 - 14 are used inorder. The system default color is used where the plots cross.
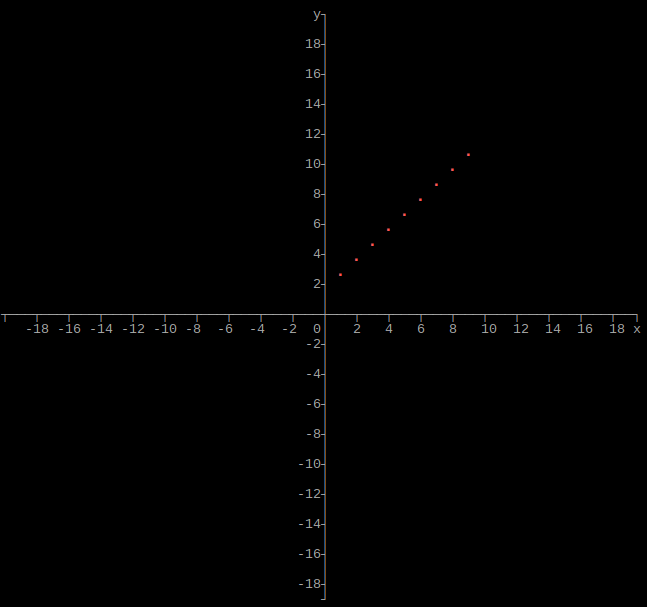
Plot
Graph
Check size
Option: check
Default value: True
Check that the width and height of the graph are not greater then the respective width and height of the terminal.