13 KiB
Table of Contents
Tables
Usage
Requires Python 3.6 or greater and if not on Linux or macOS, the wcwidth library, which users can install with:
pip3 install wcwidth
# or
python3 -m pip install wcwidth
See the tables.py file for full usage information.
Complete versions of all of the examples below and more can be found in the test.py file.
Run with: python3 -OO test.py.
Output str array as table
import tables

# Set array

tables.array(array, headerrow=True, headercolumn=True)
Table cells can contain Unicode characters and formatted text with ANSI escape sequences, but not newlines and tabs.

Output array as table with separate header row and column
import tables

headerrow = ["Header row/column 1", "Header row 2", "Header row 3", "Header row 4", "Header row 5"]
headercolumn = ["Header column 2", "Header column 3", "Header column 4", "Header column 5"]

# Set array

tables.array(array, headerrow, headercolumn, headerrow=True, headercolumn=True)
Output same as example above.
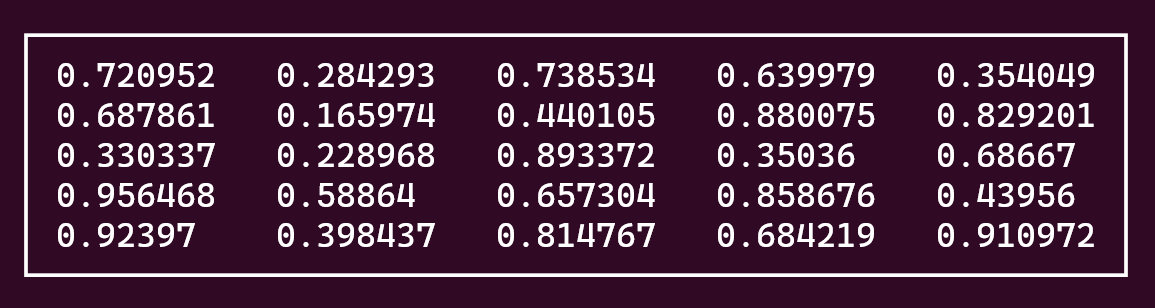
Output array as table
import tables

# Set array, can be any sequence data type

tables.array(array)
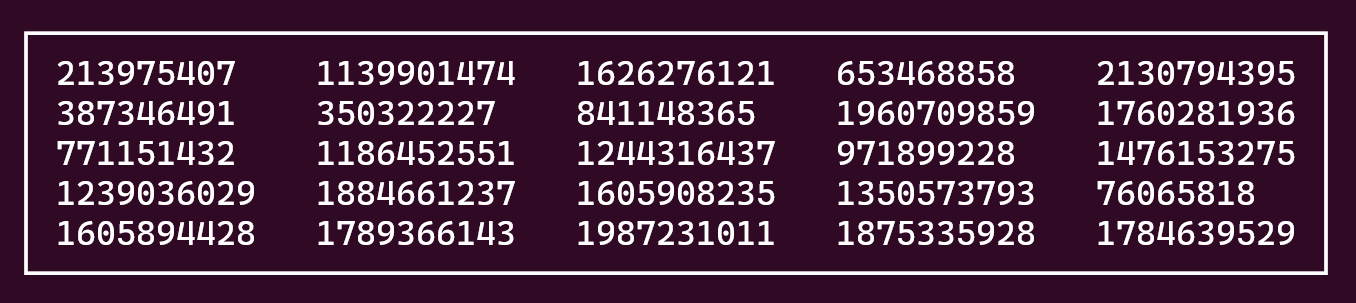
Output sorted array as table
import tables

# Set array

sortdimension = 0  # Column to sort by

array = sorted(array, key=lambda x: x[sortdimension])

tables.array(array)
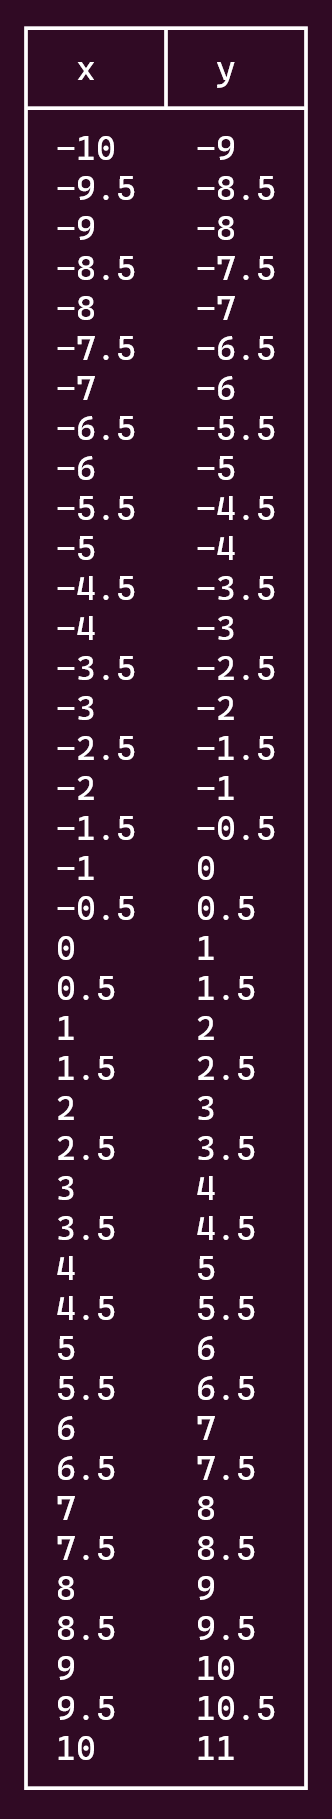
Output single function as table
import tables

def afunction(x):
	return x + 1

xmin = -10
xmax = 10
xstep = 0.5

tables.function(xmin, xmax, xstep, afunction, headerrow=True)
Output lambda function as table
import tables

xmin = -10
xmax = 10
xstep = 0.5

afunction = lambda x: x + 1

tables.function(xmin, xmax, xstep, afunction, headerrow=True)
Output same as example above.
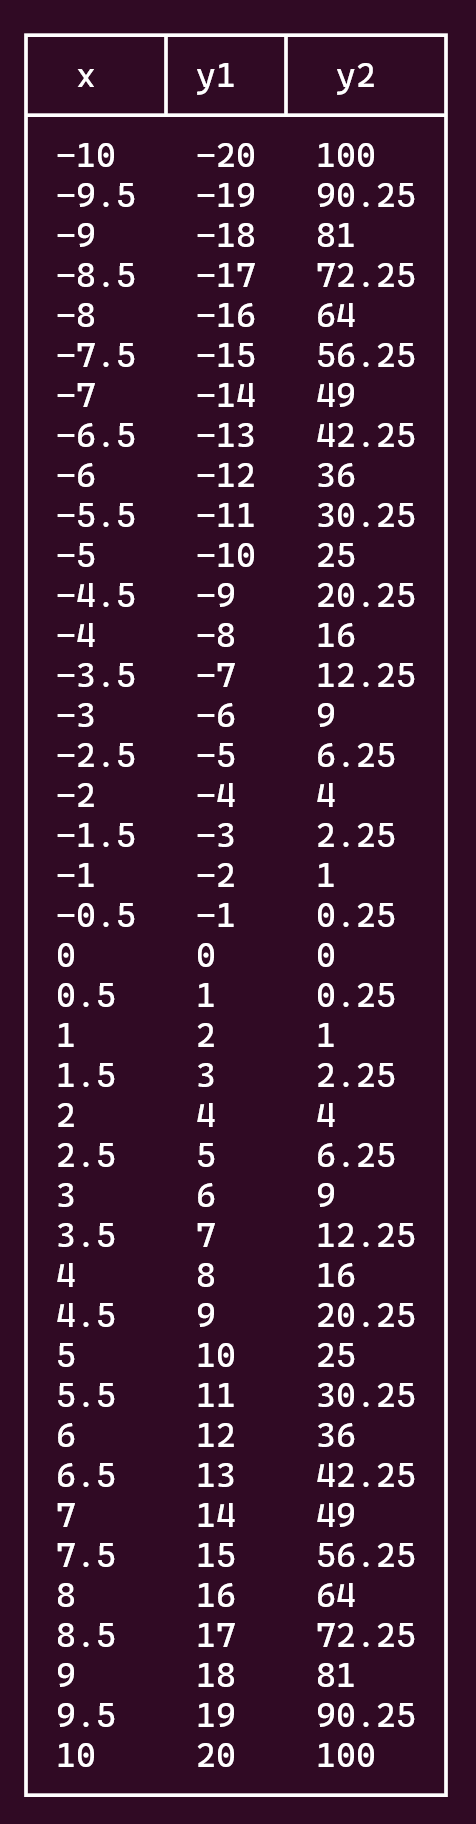
Output multiple functions as table
import tables

def function1(x):
	return 2 * x

def function2(x):
	return x ** 2

xmin = -10
xmax = 10
xstep = 0.5

# Function parameter and return value can be any data type, as long as they are the same
functions = [function1, function2]

tables.functions(xmin, xmax, xstep, functions, headerrow=True)
Output multiple lambda functions as table
import tables

xmin = -10
xmax = 10
xstep = 0.5

# Function parameter and return value can be any data type, as long as they are the same
functions = [lambda x: 2 * x, lambda x: x ** 2]

tables.functions(xmin, xmax, xstep, functions, headerrow=True)
Output same as example above.
Options
Header row
Option: headerrow
Default value: False
Header rows are bolded, centered and have a border.
Header column
Option: headercolumn
Default value: False
Header columns are bolded, centered and have a border.
Table border
Option: tableborder
Default value: True
Cell border
Option: cellborder
Default value: False
Cell padding
Option: padding
Default value: 1
Alignment
Option: alignment
Values:
None(default)False(left)True(right)
Title
Option: title
Default value: None
The title is output at the top of the table. It is word wrapped based on the current width of the terminal. Handles newlines, tabs and Unicode characters.
Border style
Option: style
Values:
style_types.ASCII: ASCII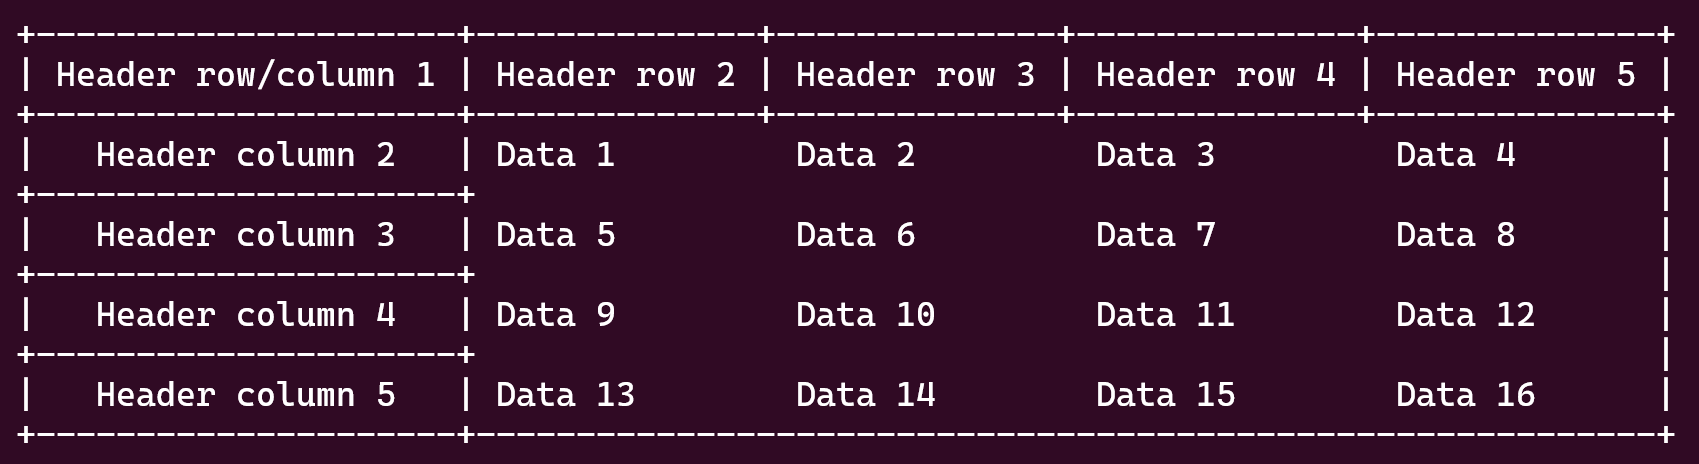
style_types.basic: Basic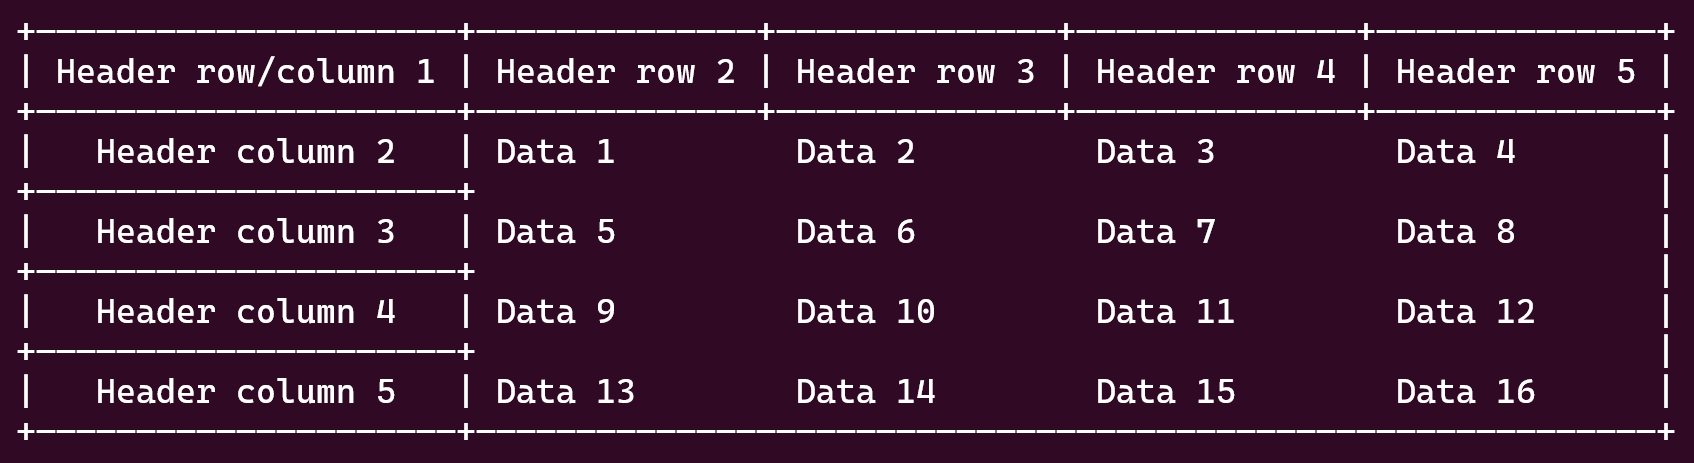
style_types.light: Light (default)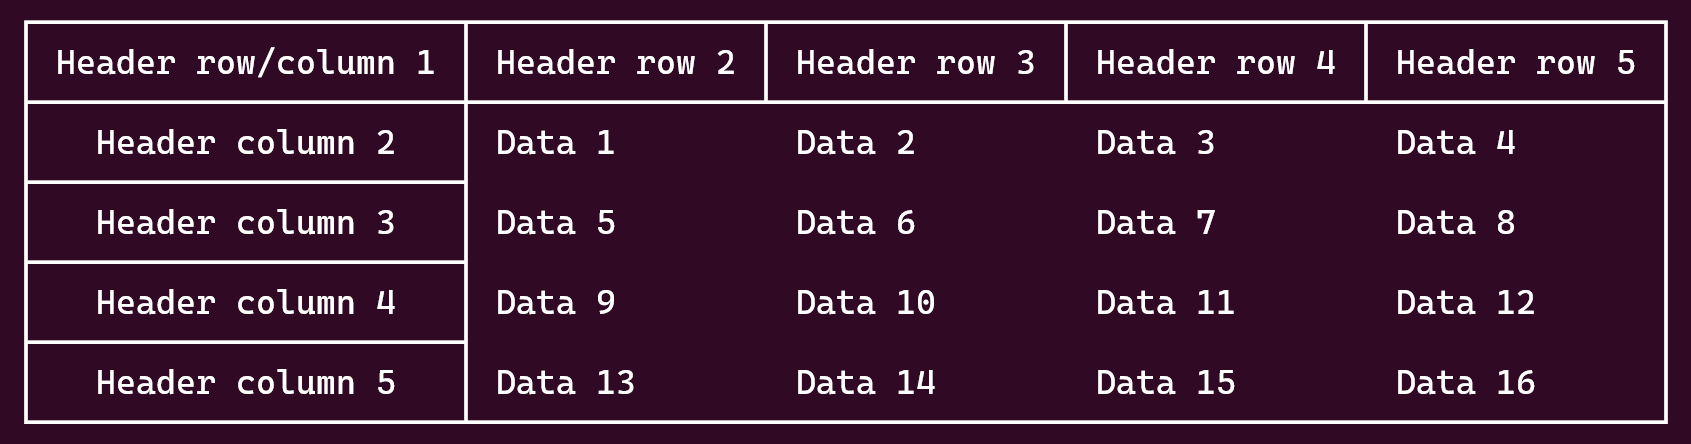
style_types.heavy: Heavy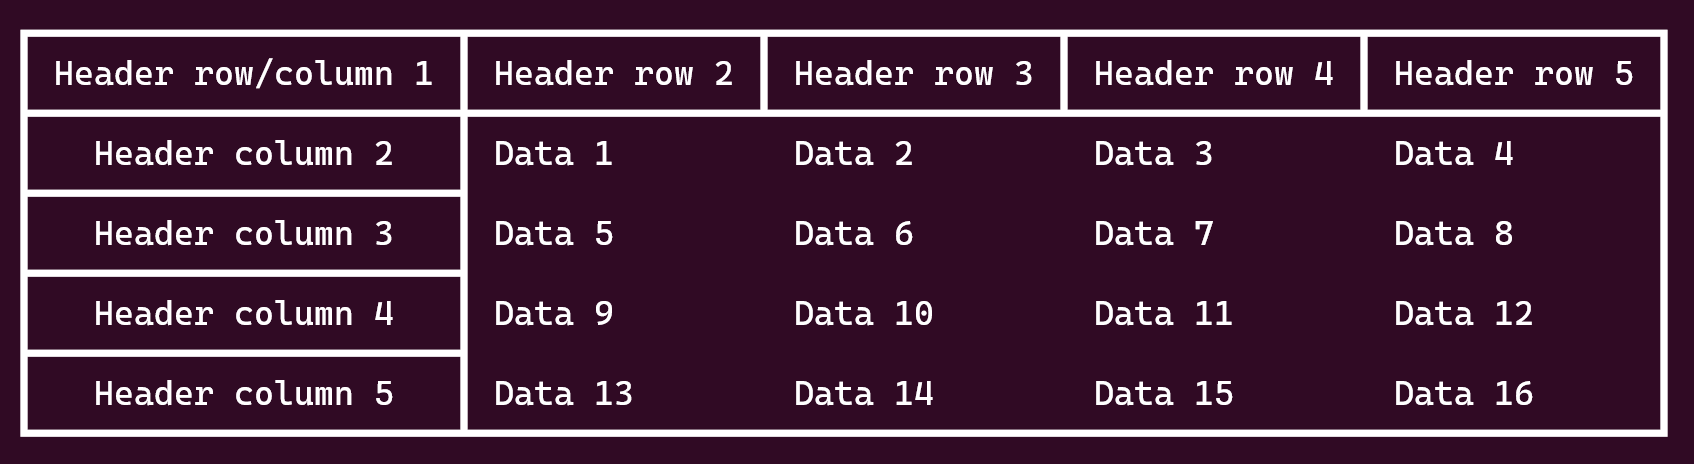
style_types.double: Double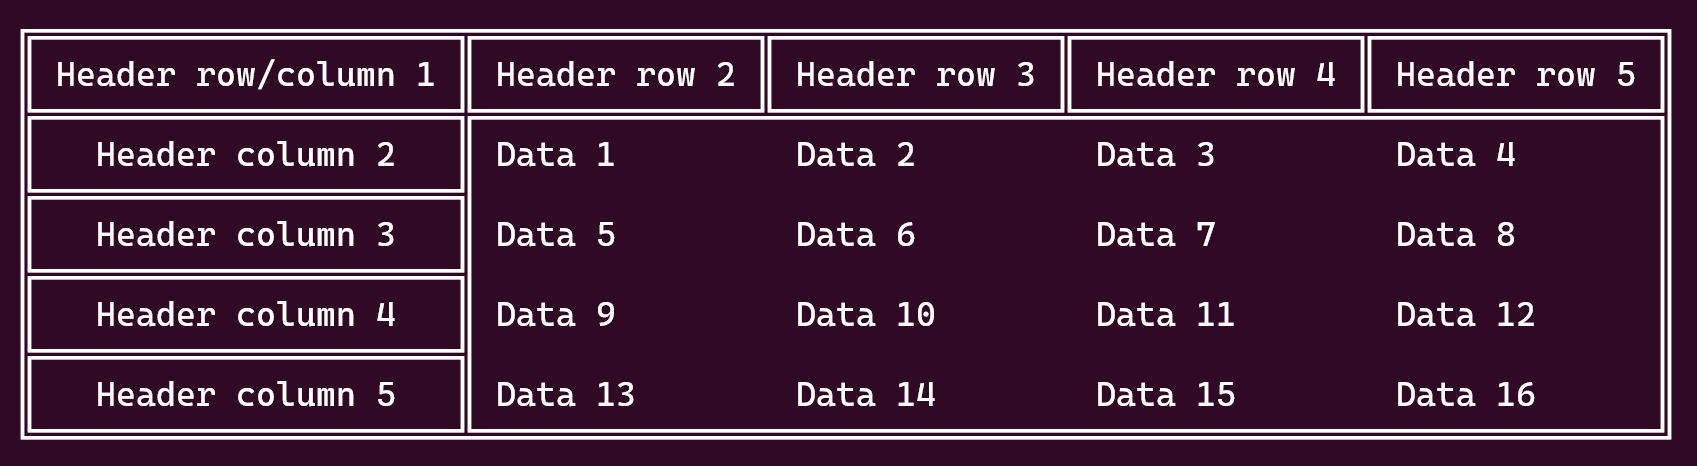
style_types.arc: Light Arc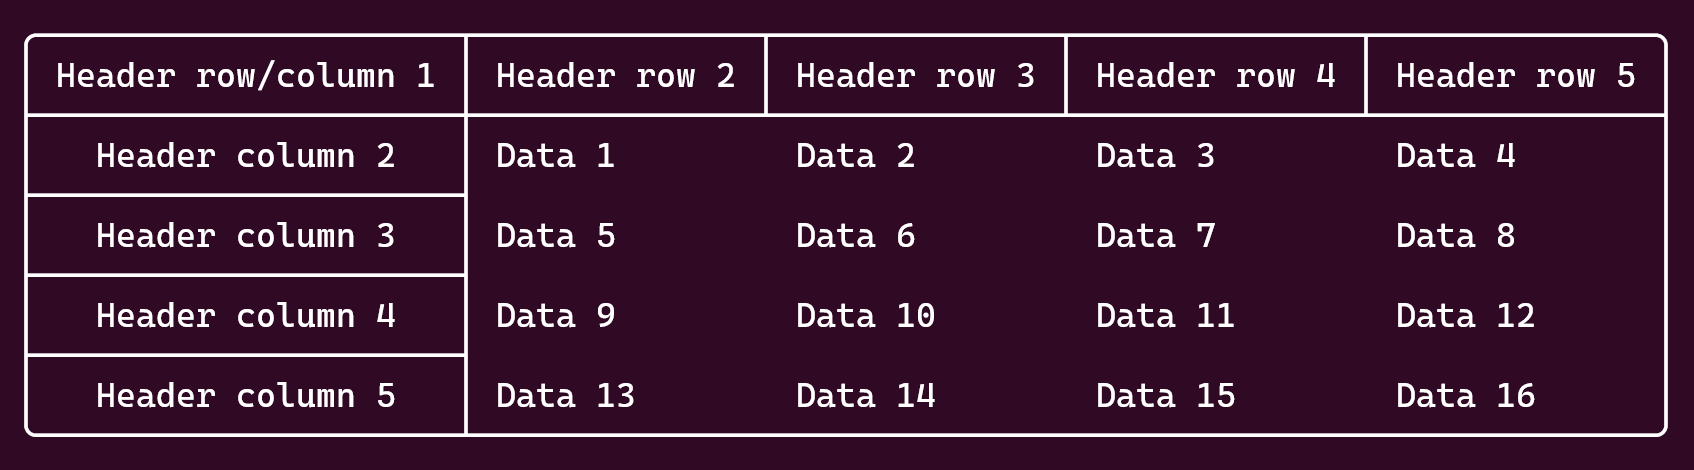
style_types.light_dashed: Light Dashed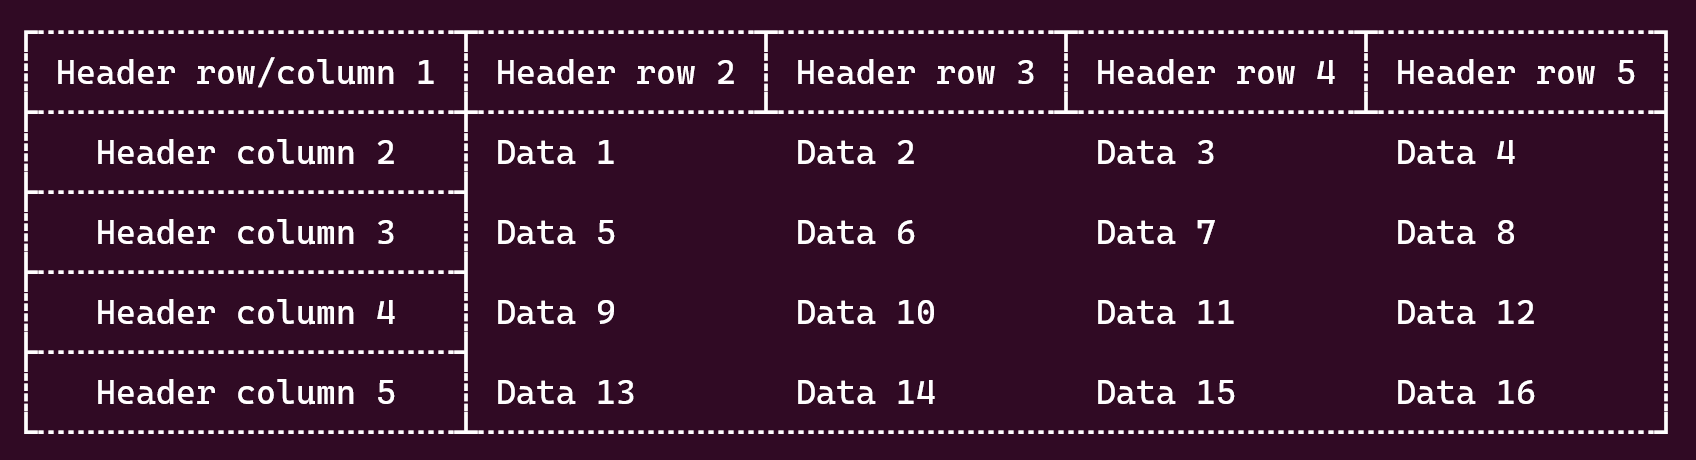
style_types.heavy_dashed: Heavy Dashed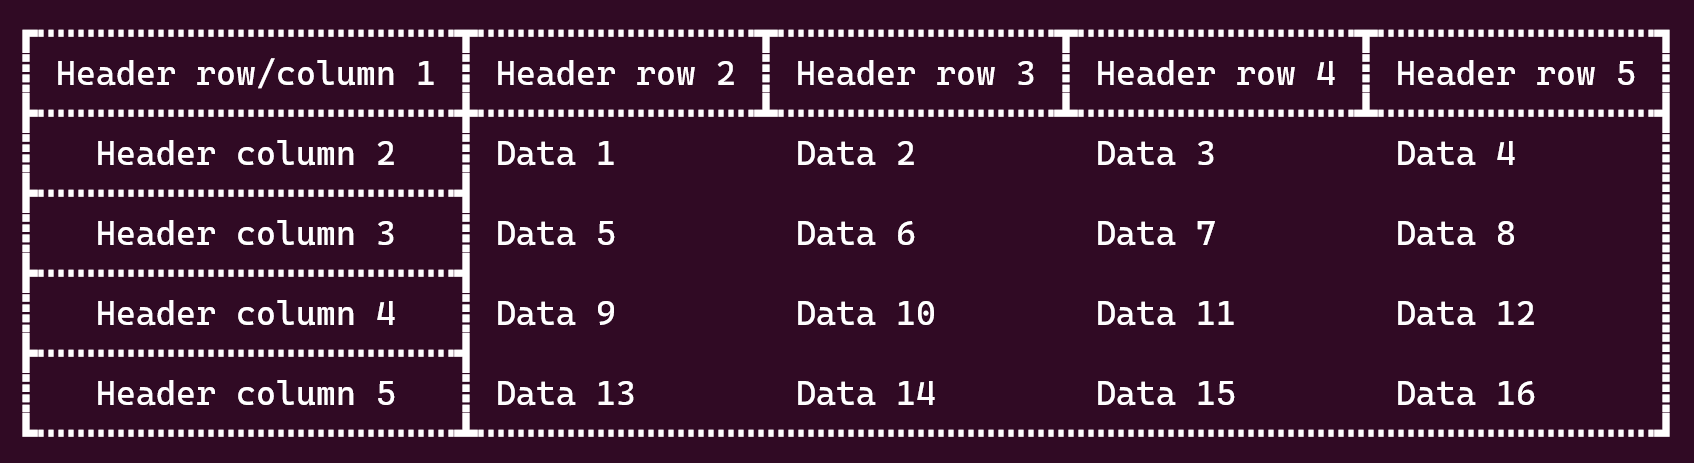
Check size
Option: check
Default value: True
Check that the width of the table is not greater then the width of the terminal.
Graphs/Plots
Usage
Requires Python 3.6 or greater and if not on Linux or macOS, the wcwidth library, which users can install with:
pip3 install wcwidth
# or
python3 -m pip install wcwidth
See the graphs.py file for full usage information.
Complete versions of all of the examples below and more can be found in the test.py file.
Run with: python3 -OO test.py.
If height is 0, it will be set to the current height of the terminal (number of rows times four). If width is 0, it will be set to the current width of the terminal (number of columns times two).
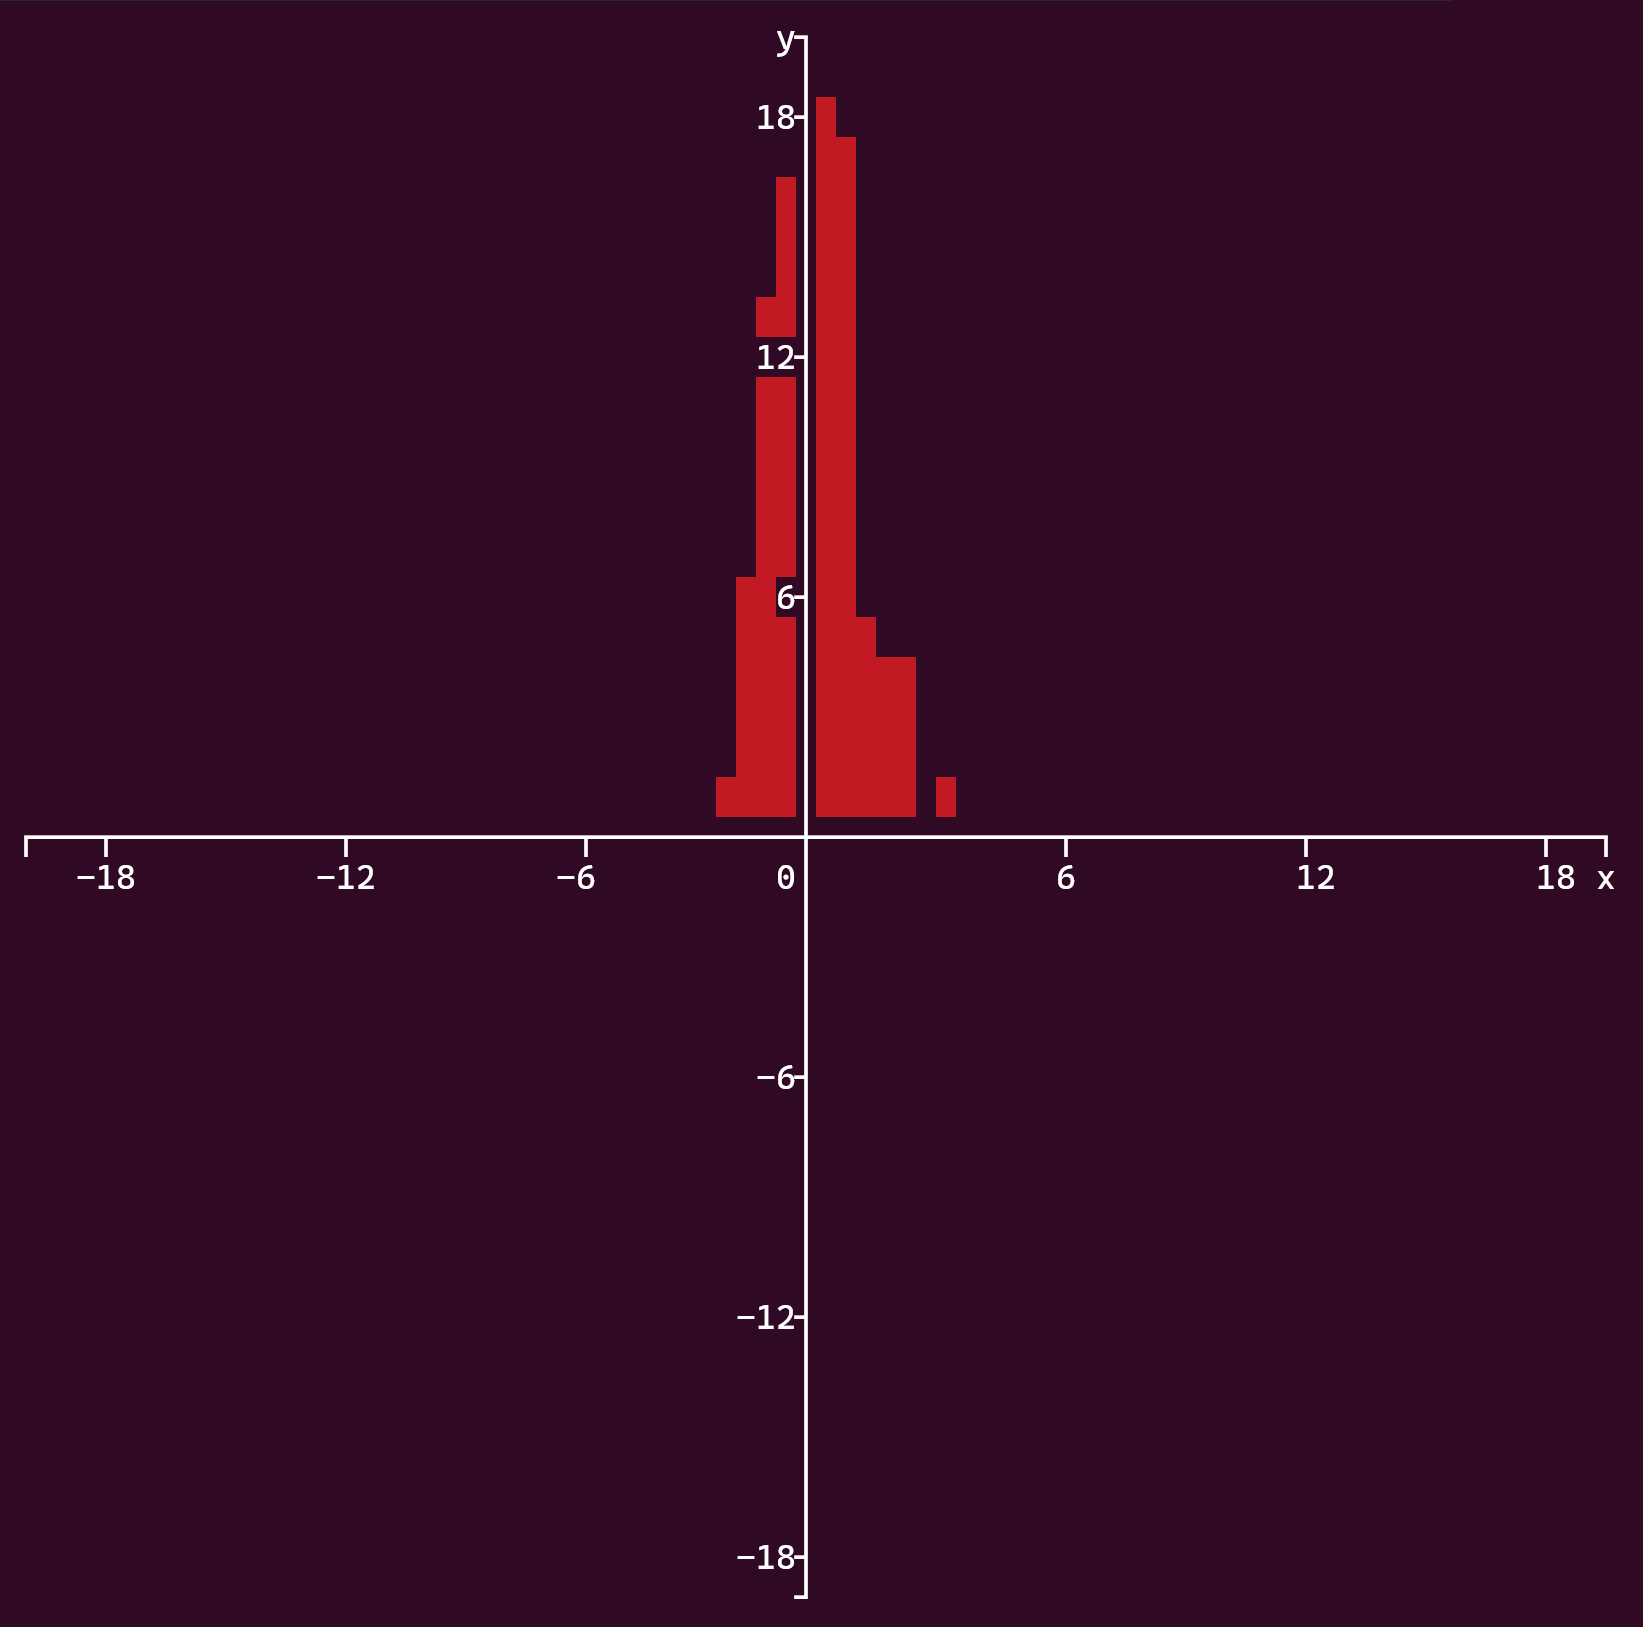
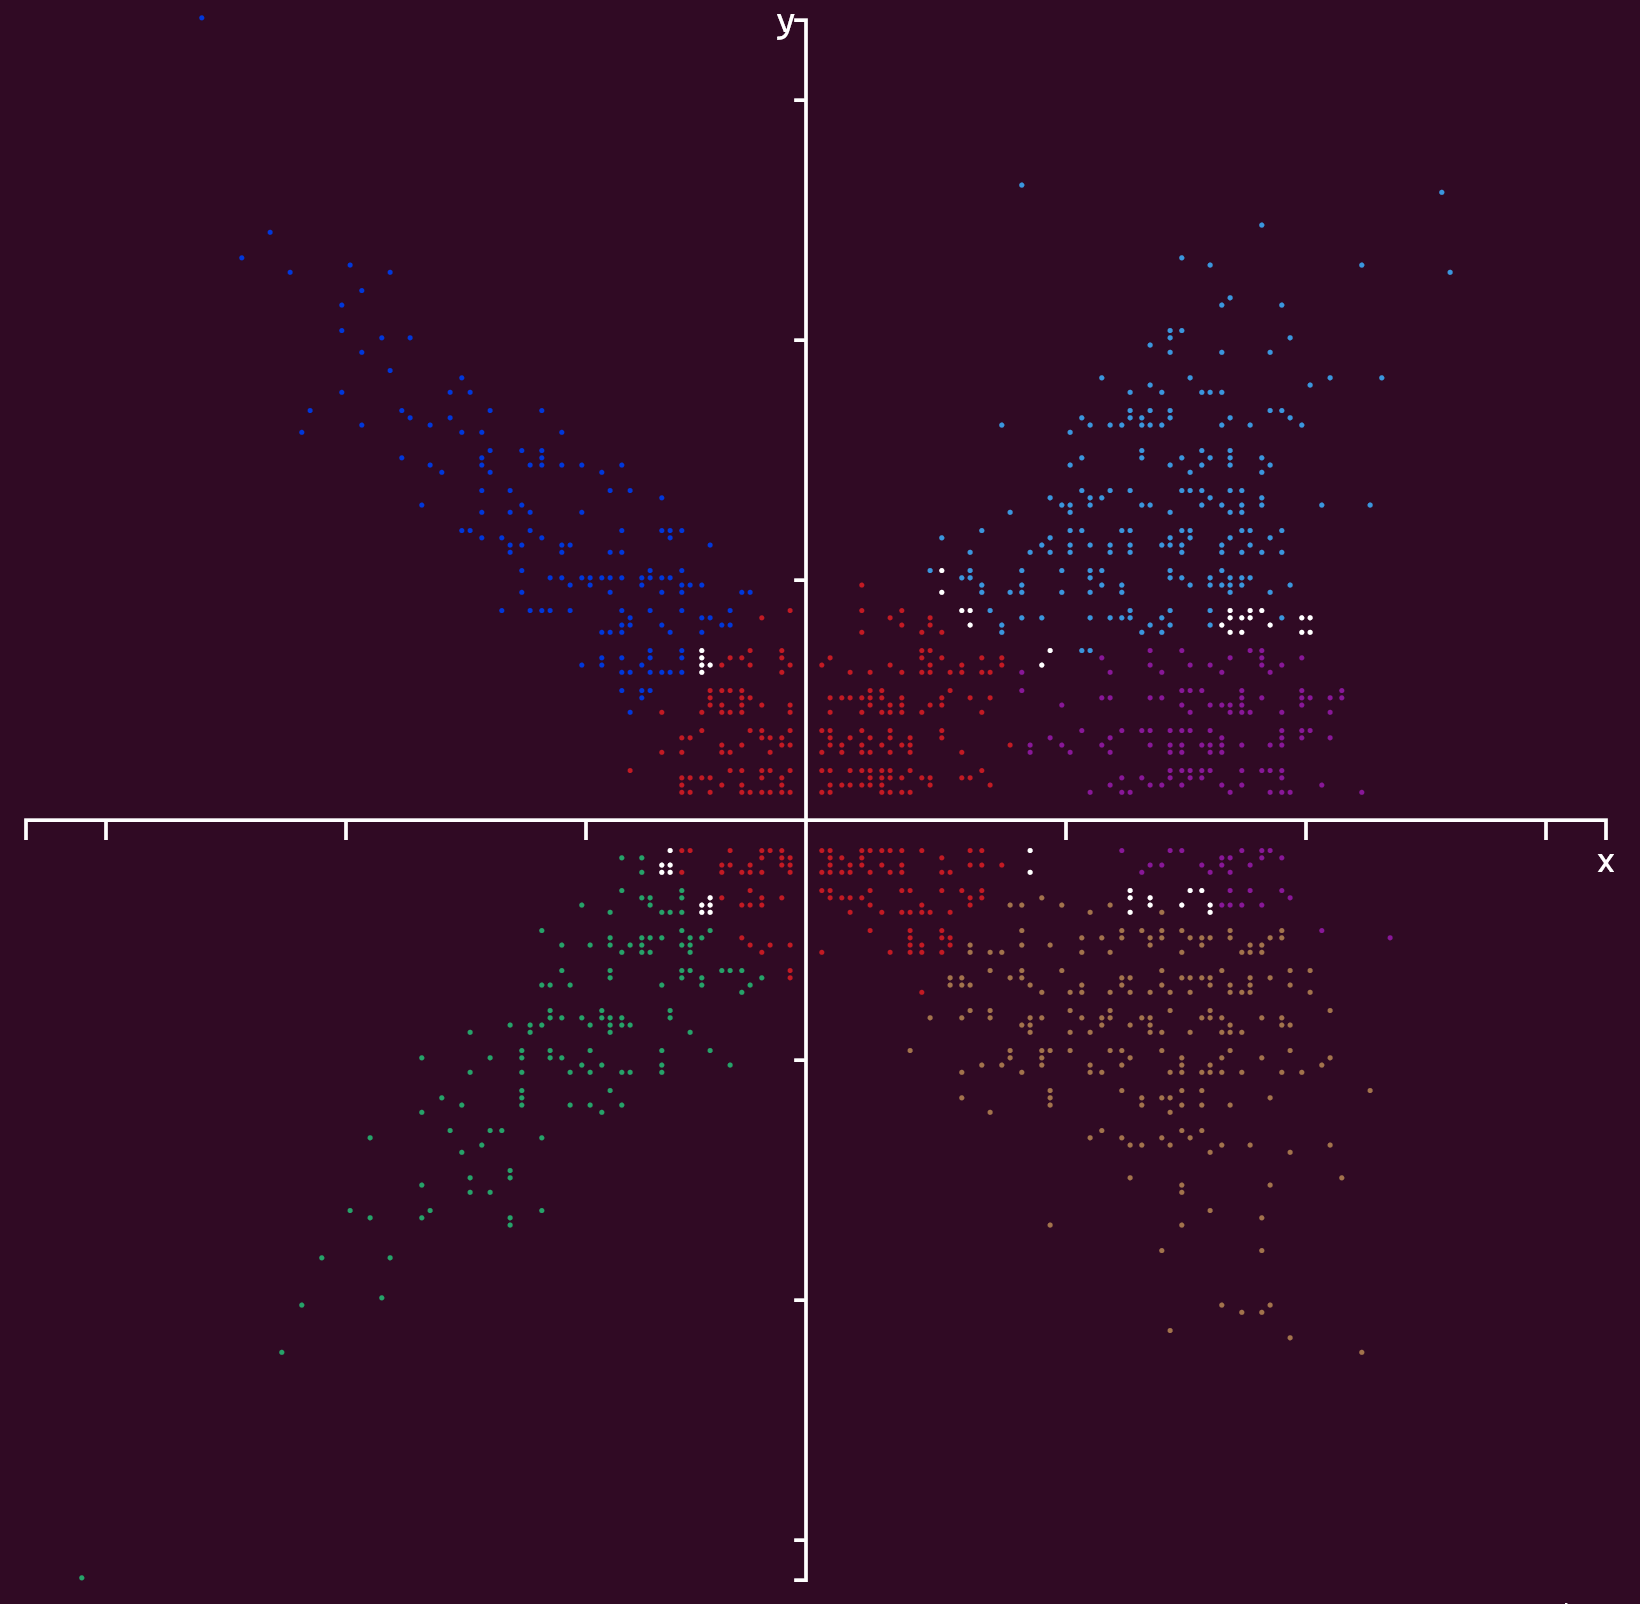
Output array as histogram
import graphs

height = 160
width = 160

xmin = -20
xmax = 20
ymin = -20
ymax = 20

# Set array, can be any sequence data type

graphs.histogram(height, width, xmin, xmax, ymin, ymax, array)
If xmin and xmax are both 0, they will be set to the respective minimum and maximum values of x in the array. If ymin and ymax are both 0, they will be set to the respective minimum and maximum values of y in the resulting histogram.
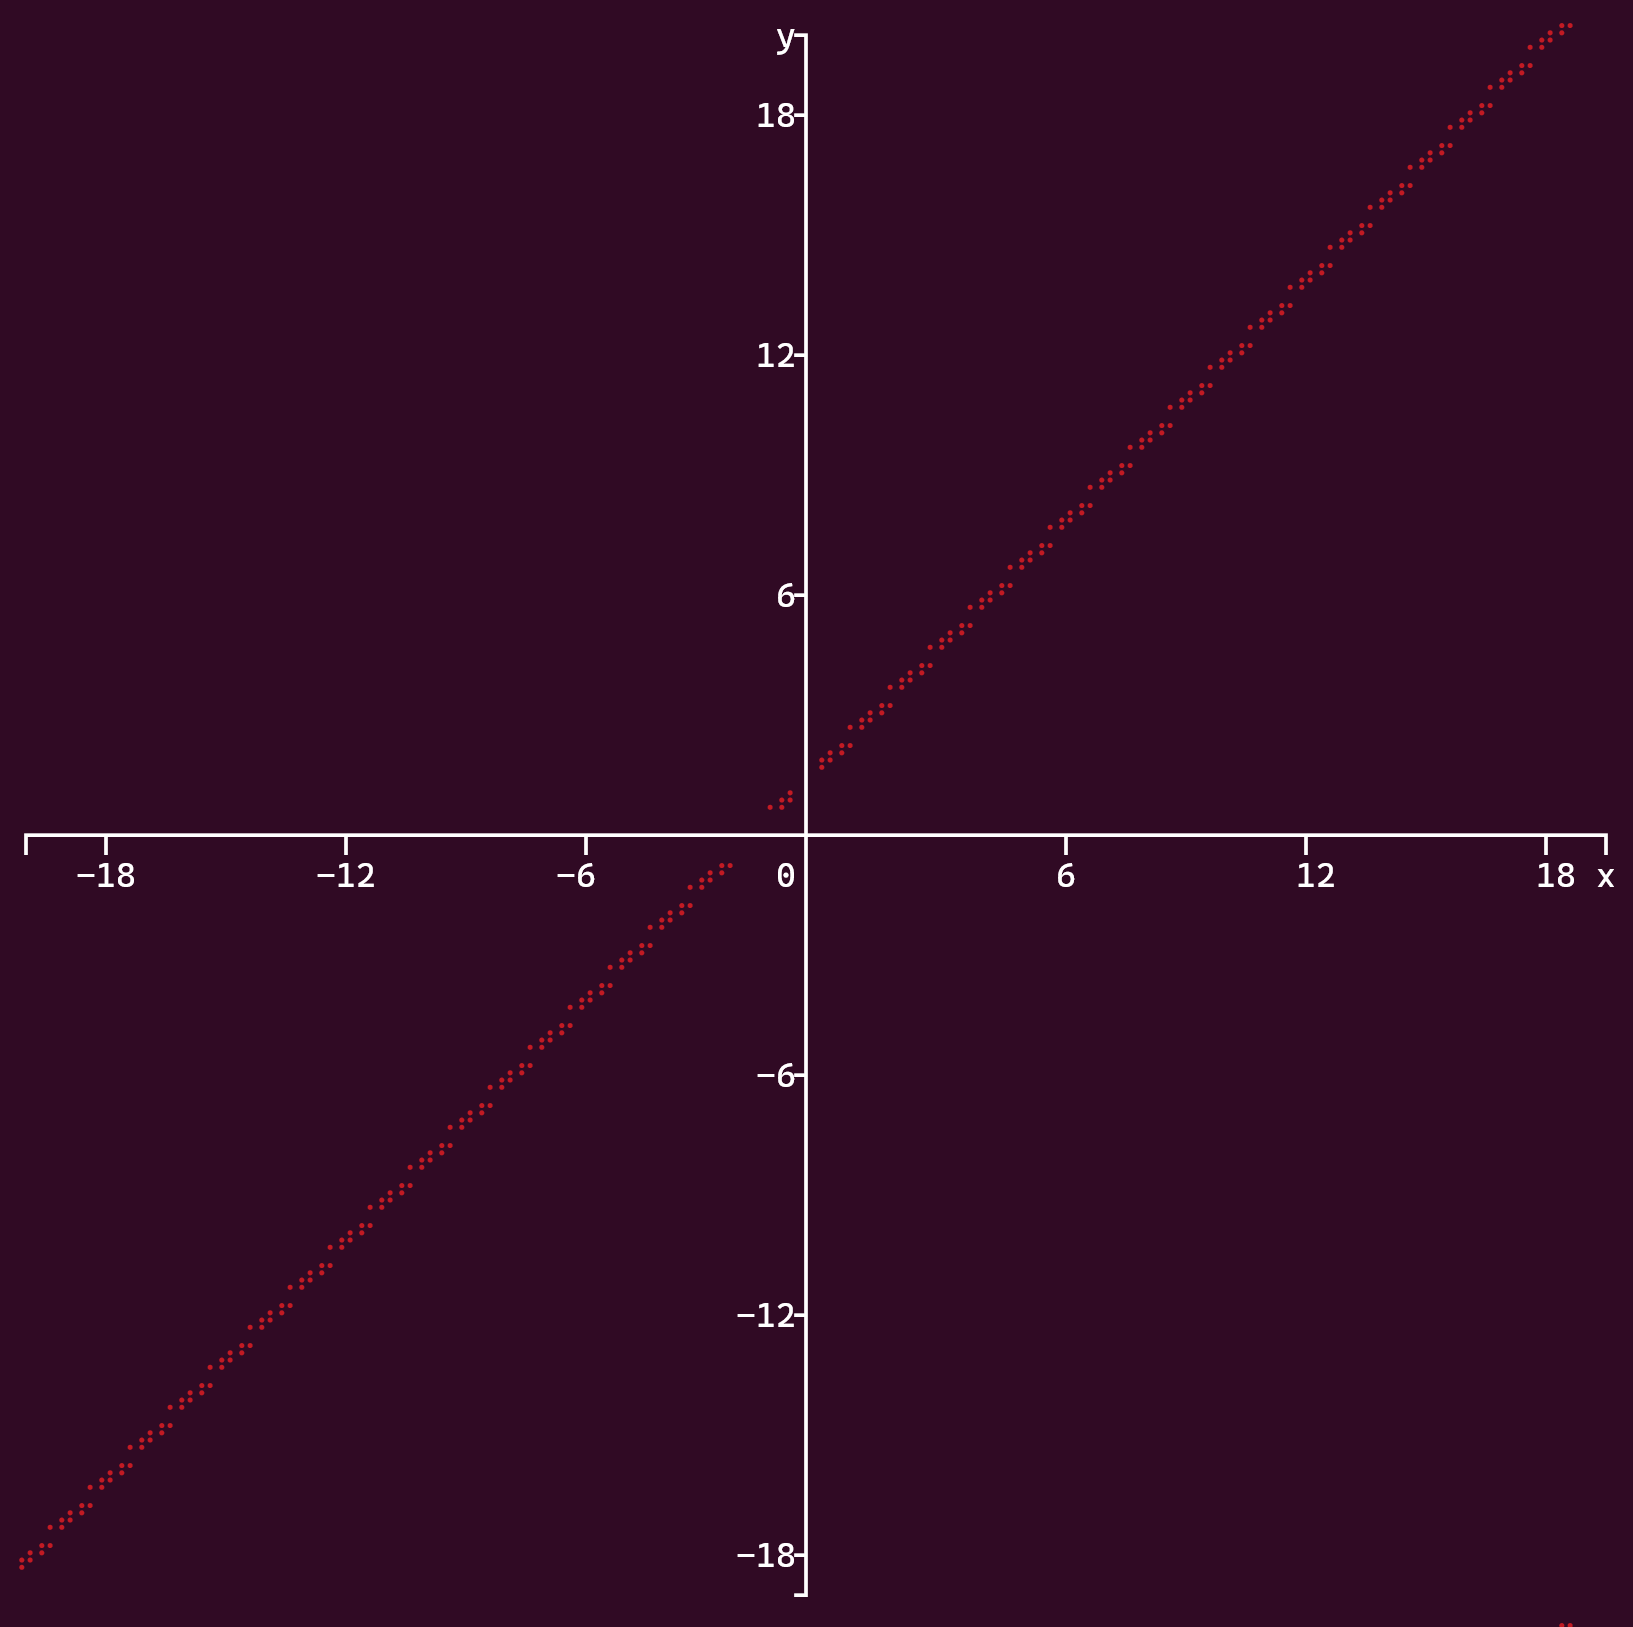
Output single array as plot
import graphs

height = 160
width = 160

xmin = -20
xmax = 20
ymin = -20
ymax = 20

# Set array, can be any sequence data type, but must have exactly two columns

graphs.plot(height, width, xmin, xmax, ymin, ymax, array)
If xmin and xmax are both 0, they will be set to the respective minimum and maximum values of x in the array. If ymin and ymax are both 0, they will be set to the respective minimum and maximum values of y in the array.

Use graphs.plots() to plot multiple arrays, which can be of different sizes.
Output single function as graph
import graphs

def afunction(x):
	return x + 1

height = 160
width = 160

xmin = -20
xmax = 20
ymin = -20
ymax = 20

graphs.function(height, width, xmin, xmax, ymin, ymax, afunction)
Output lambda function as graph
import graphs

height = 160
width = 160

xmin = -20
xmax = 20
ymin = -20
ymax = 20

afunction = lambda x: x + 1

graphs.function(height, width, xmin, xmax, ymin, ymax, afunction)
Output same as example above.
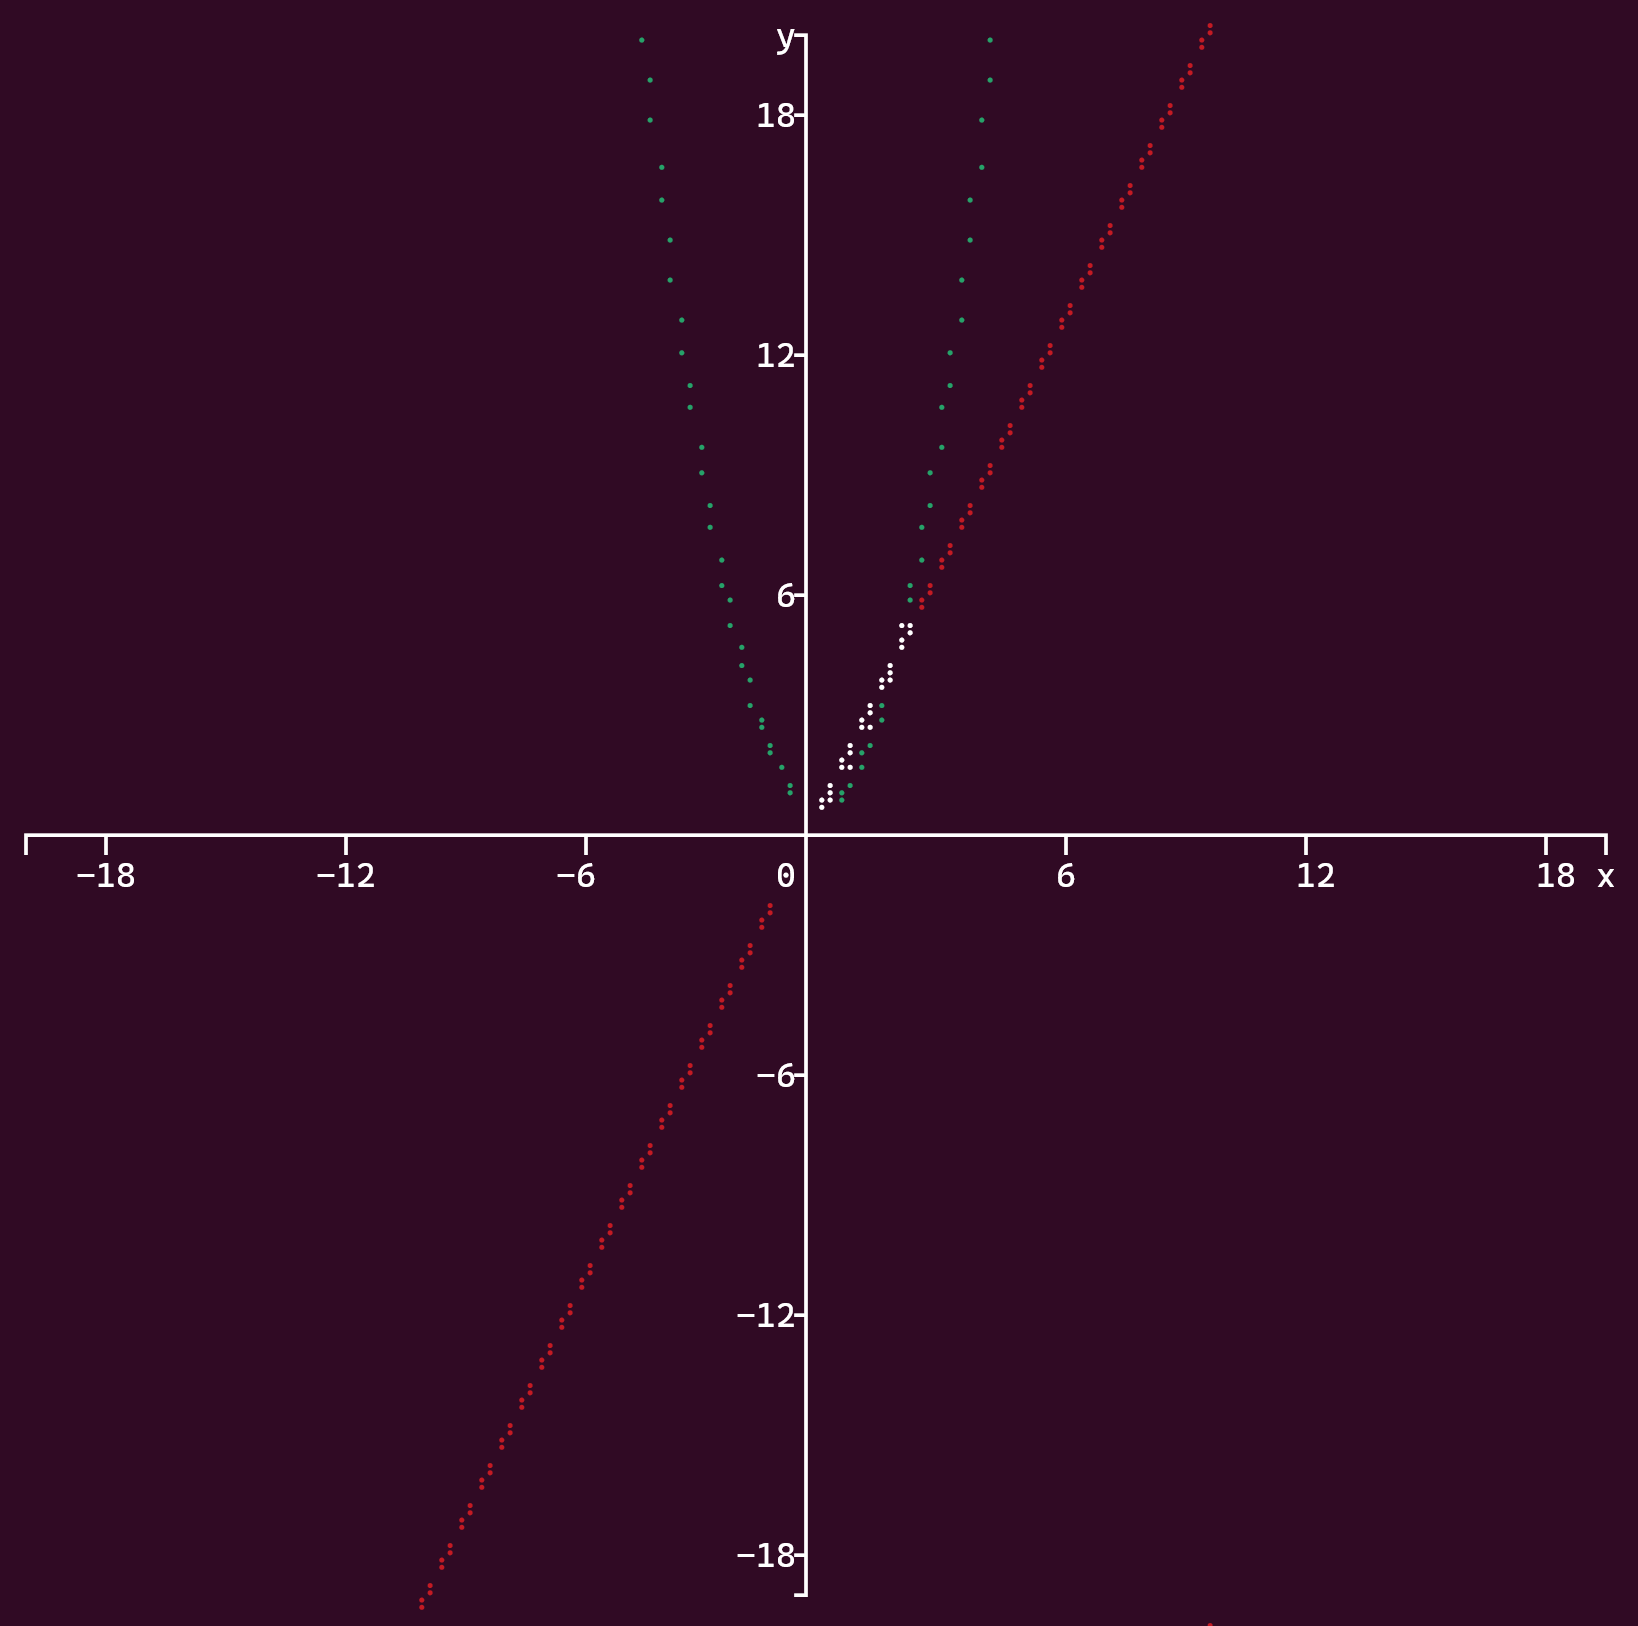
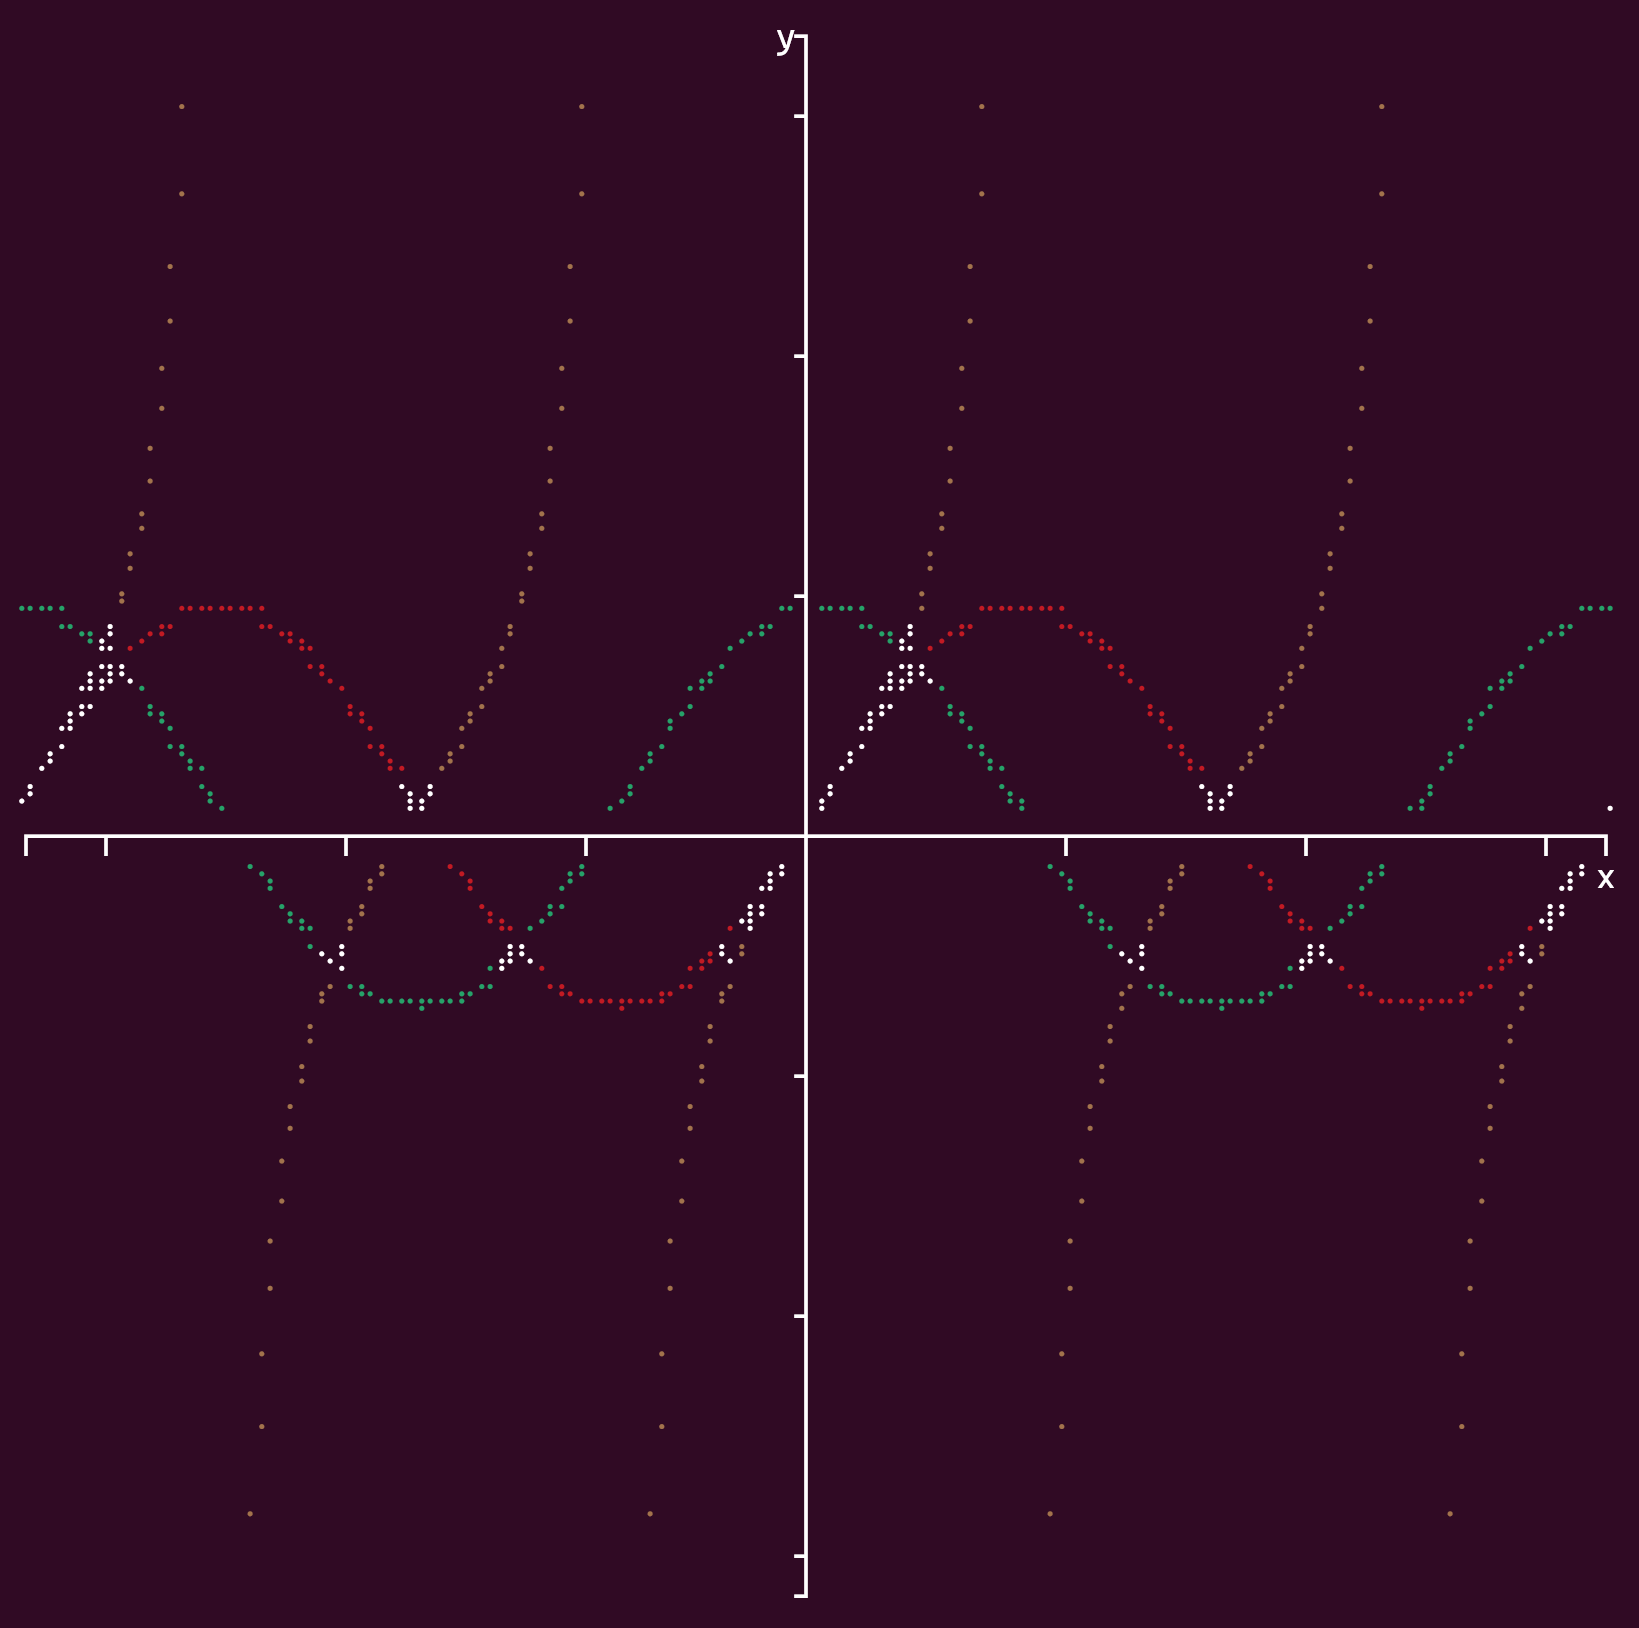
Output multiple functions as graph
import graphs

def function1(x):
	return 2 * x

def function2(x):
	return x ** 2

height = 160
width = 160

xmin = -20
xmax = 20
ymin = -20
ymax = 20

# Function parameter and return value can be any data type, as long as they are the same
functions = [function1, function2]

graphs.functions(height, width, xmin, xmax, ymin, ymax, functions)
Output multiple lambda functions as graph
import graphs

height = 160
width = 160

xmin = -20
xmax = 20
ymin = -20
ymax = 20

# Function parameter and return value can be any data type, as long as they are the same
functions = [lambda x: 2 * x, lambda x: x ** 2]

graphs.functions(height, width, xmin, xmax, ymin, ymax, functions)
Output same as example above.
Options
Border
Option: border
Default value: False
Axis
Option: axis
Default value: True
Axis labels
Option: axislabel
Default value: True
Requires axis to be True.
Axis tick marks
Option: axistick
Default value: True
Requires axis to be True.
Axis units labels
Option: axisunitslabel
Default value: True
Requires axis and axistick to be True.
X-axis units format
Option: xunits
Values:
units_types.number: Locale number formatunits_types.scale_none: Locale number format with full precisionunits_types.scale_SI: Auto-scale to the SI standardunits_types.scale_IEC: Auto-scale to the IEC standardunits_types.scale_IEC_I: Auto-scale to the IEC standardunits_types.fracts: Locale number format, but convert fractions and mathematical constants to Unicode characters (default)units_types.percent: Percentage formatunits_types.date: Locale date formatunits_types.time: Locale time formatunits_types.monetary: Locale monetary/currency format
Formats 2-5 are similar to the respective --to options with the numfmt command from GNU Coreutils, but with more precision.
Y-axis units format
Option: yunits
Values: Same as above.
Type
Option: type
Values:
type_types.braille: Braille (default)
type_types.block: Block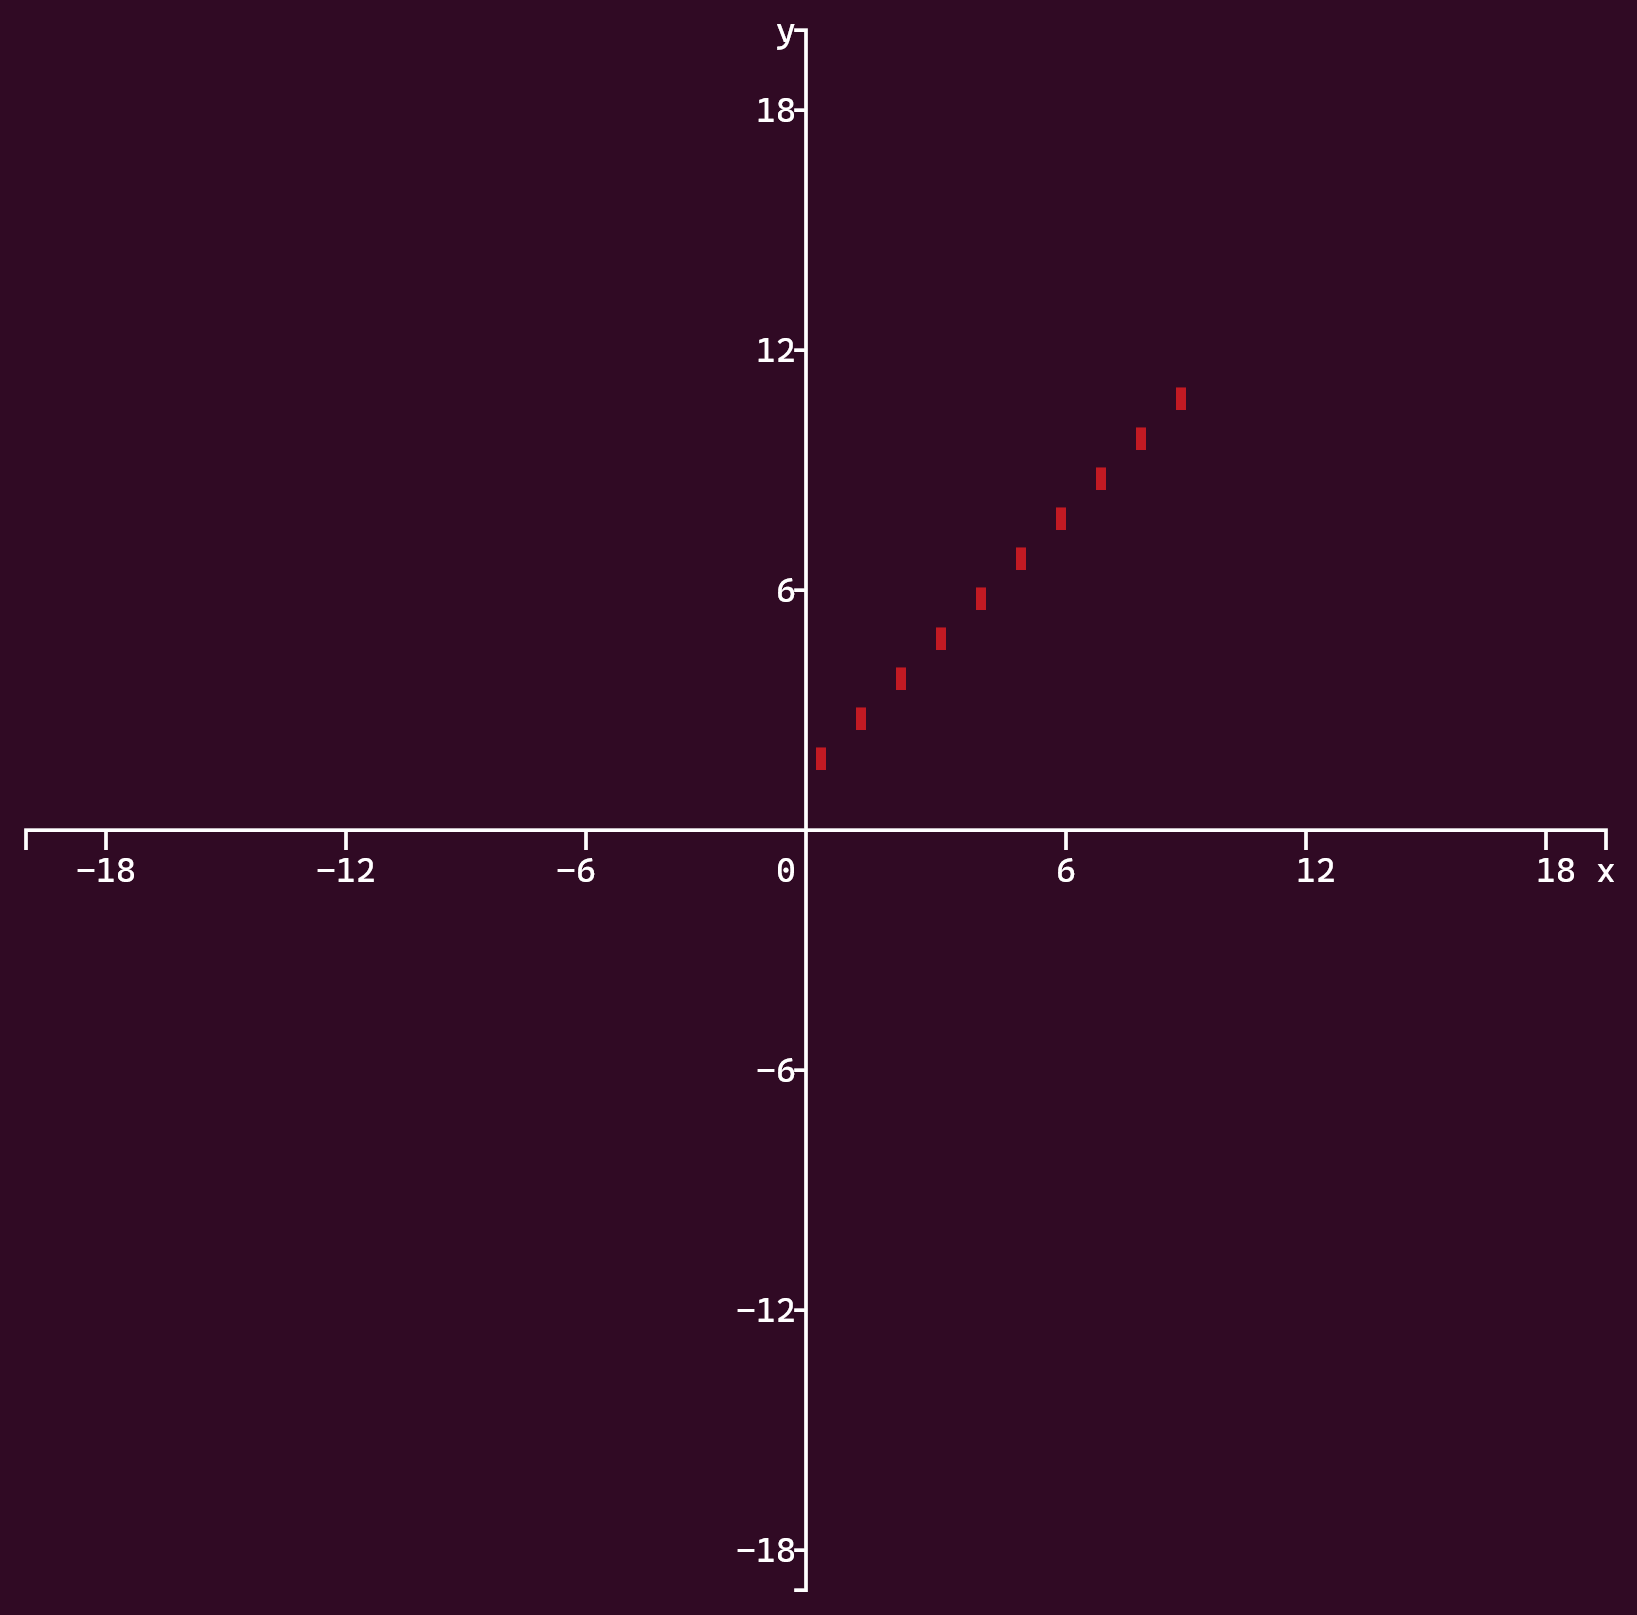
The Braille type has the highest resolution of 2×4 pixels per character, while the block type uses 2×2. This option is only used for plots and graphs. Histograms use 1×8 pixels per character.
Mark type
Option: mark
Values:
mark_types.dot: Dot (default)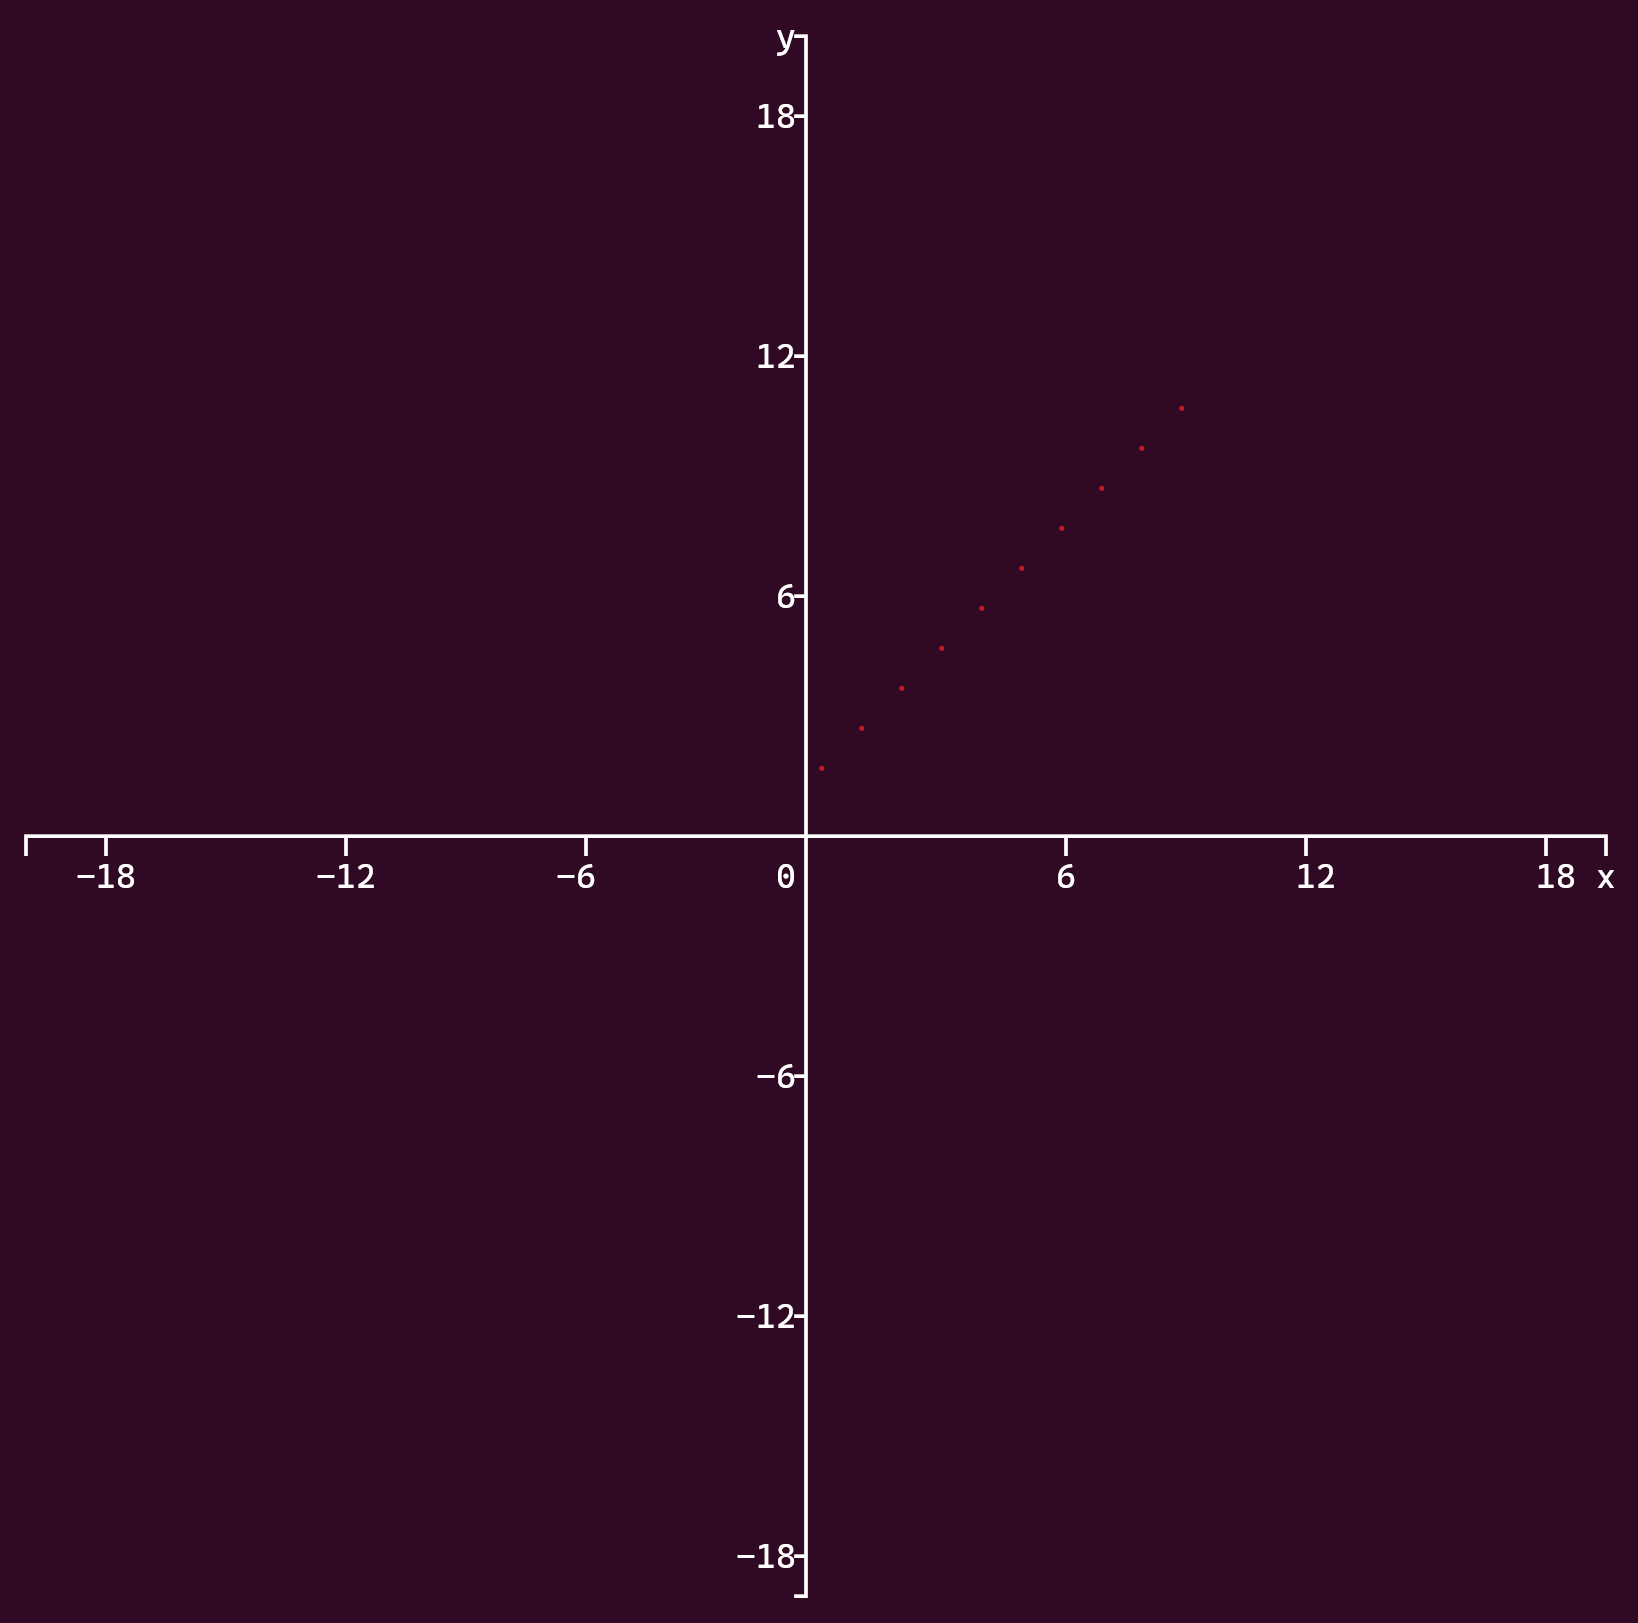
mark_types.plus: Plus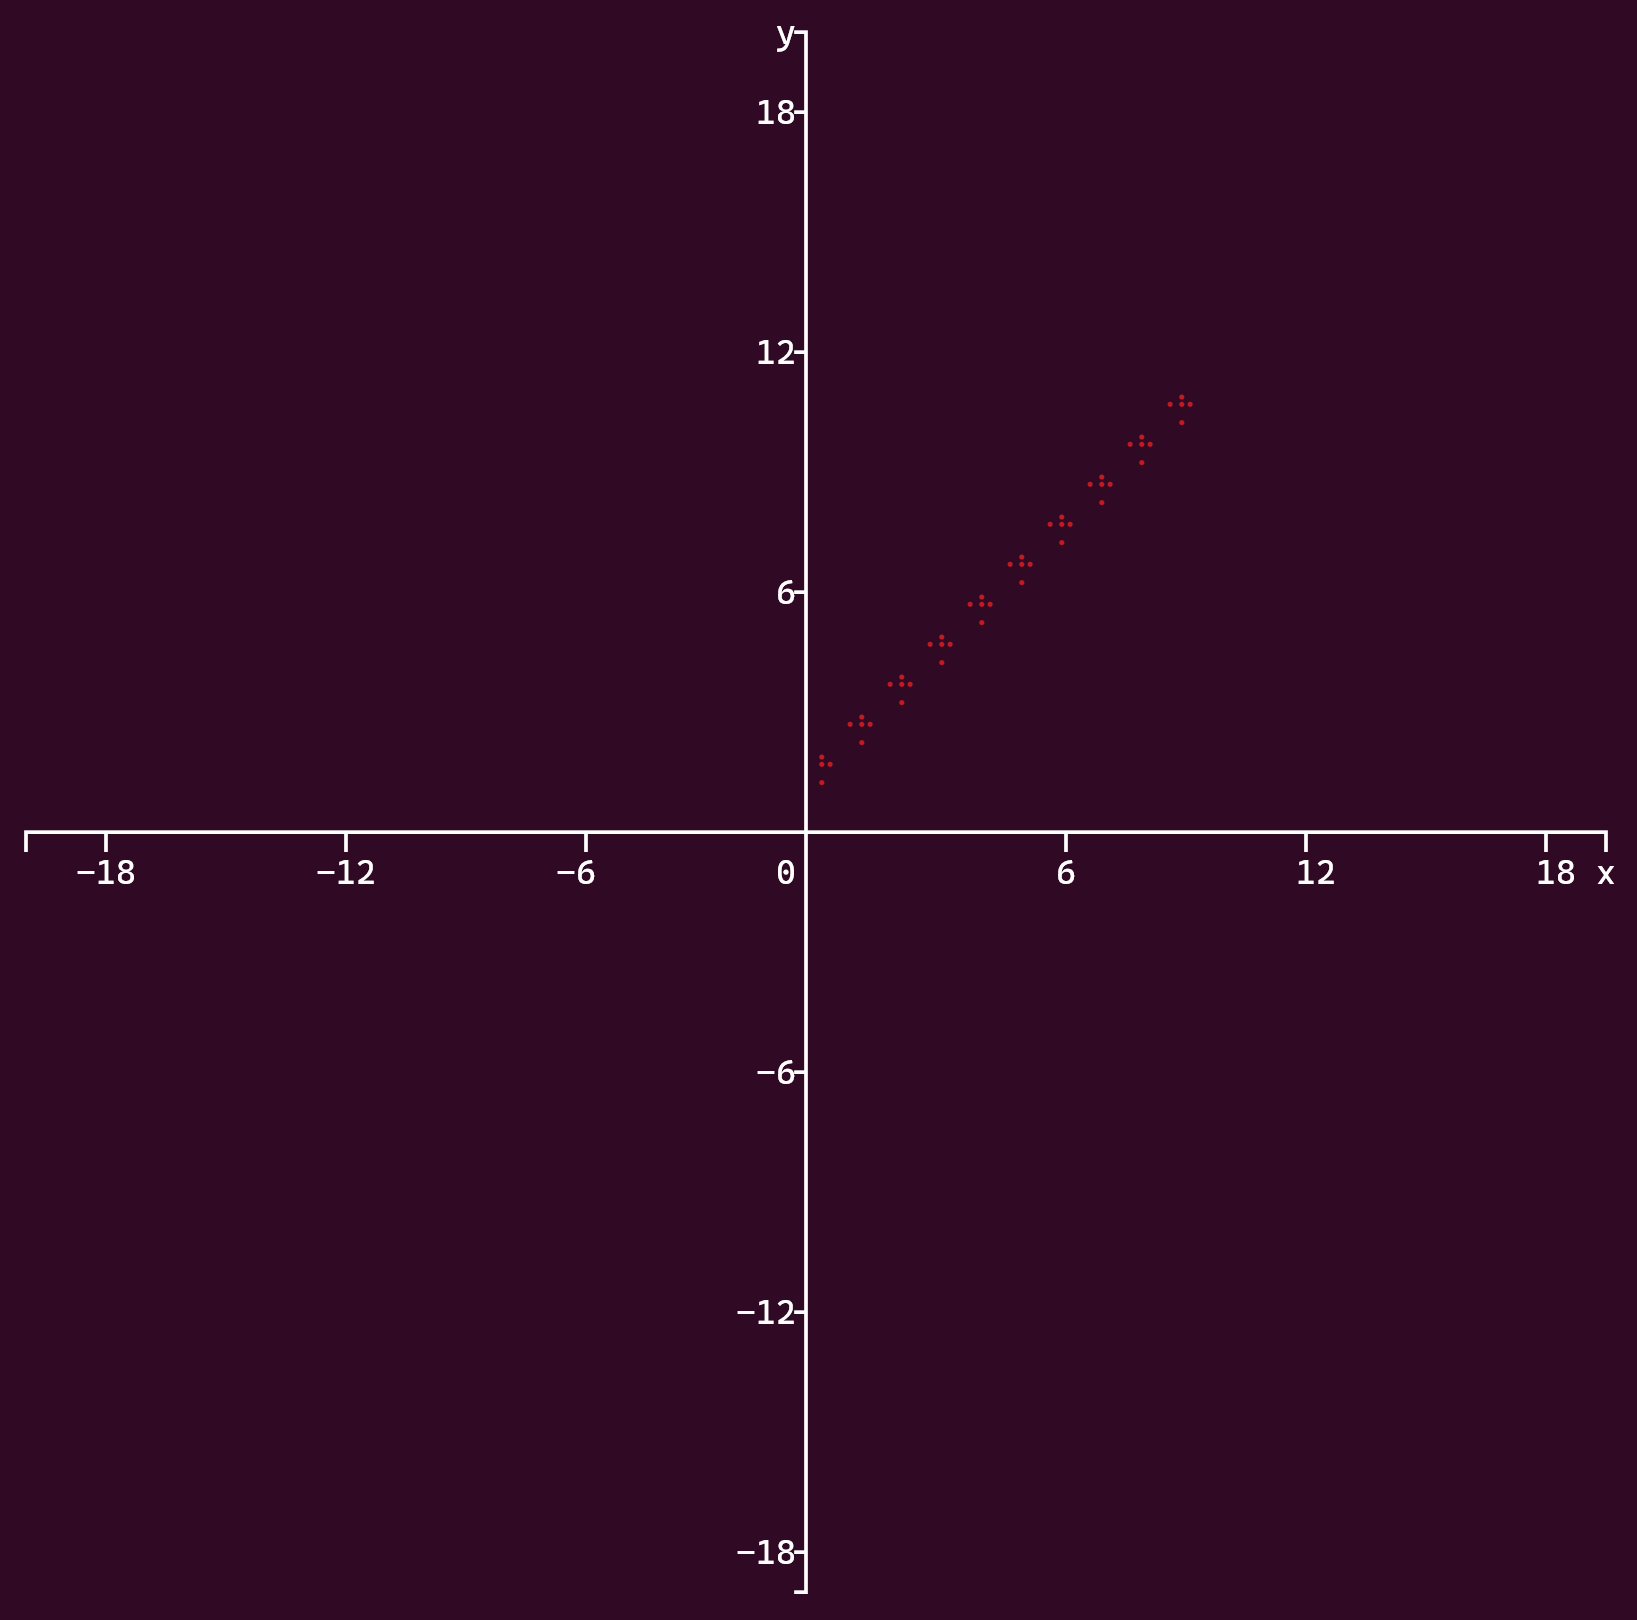
mark_types.square: Square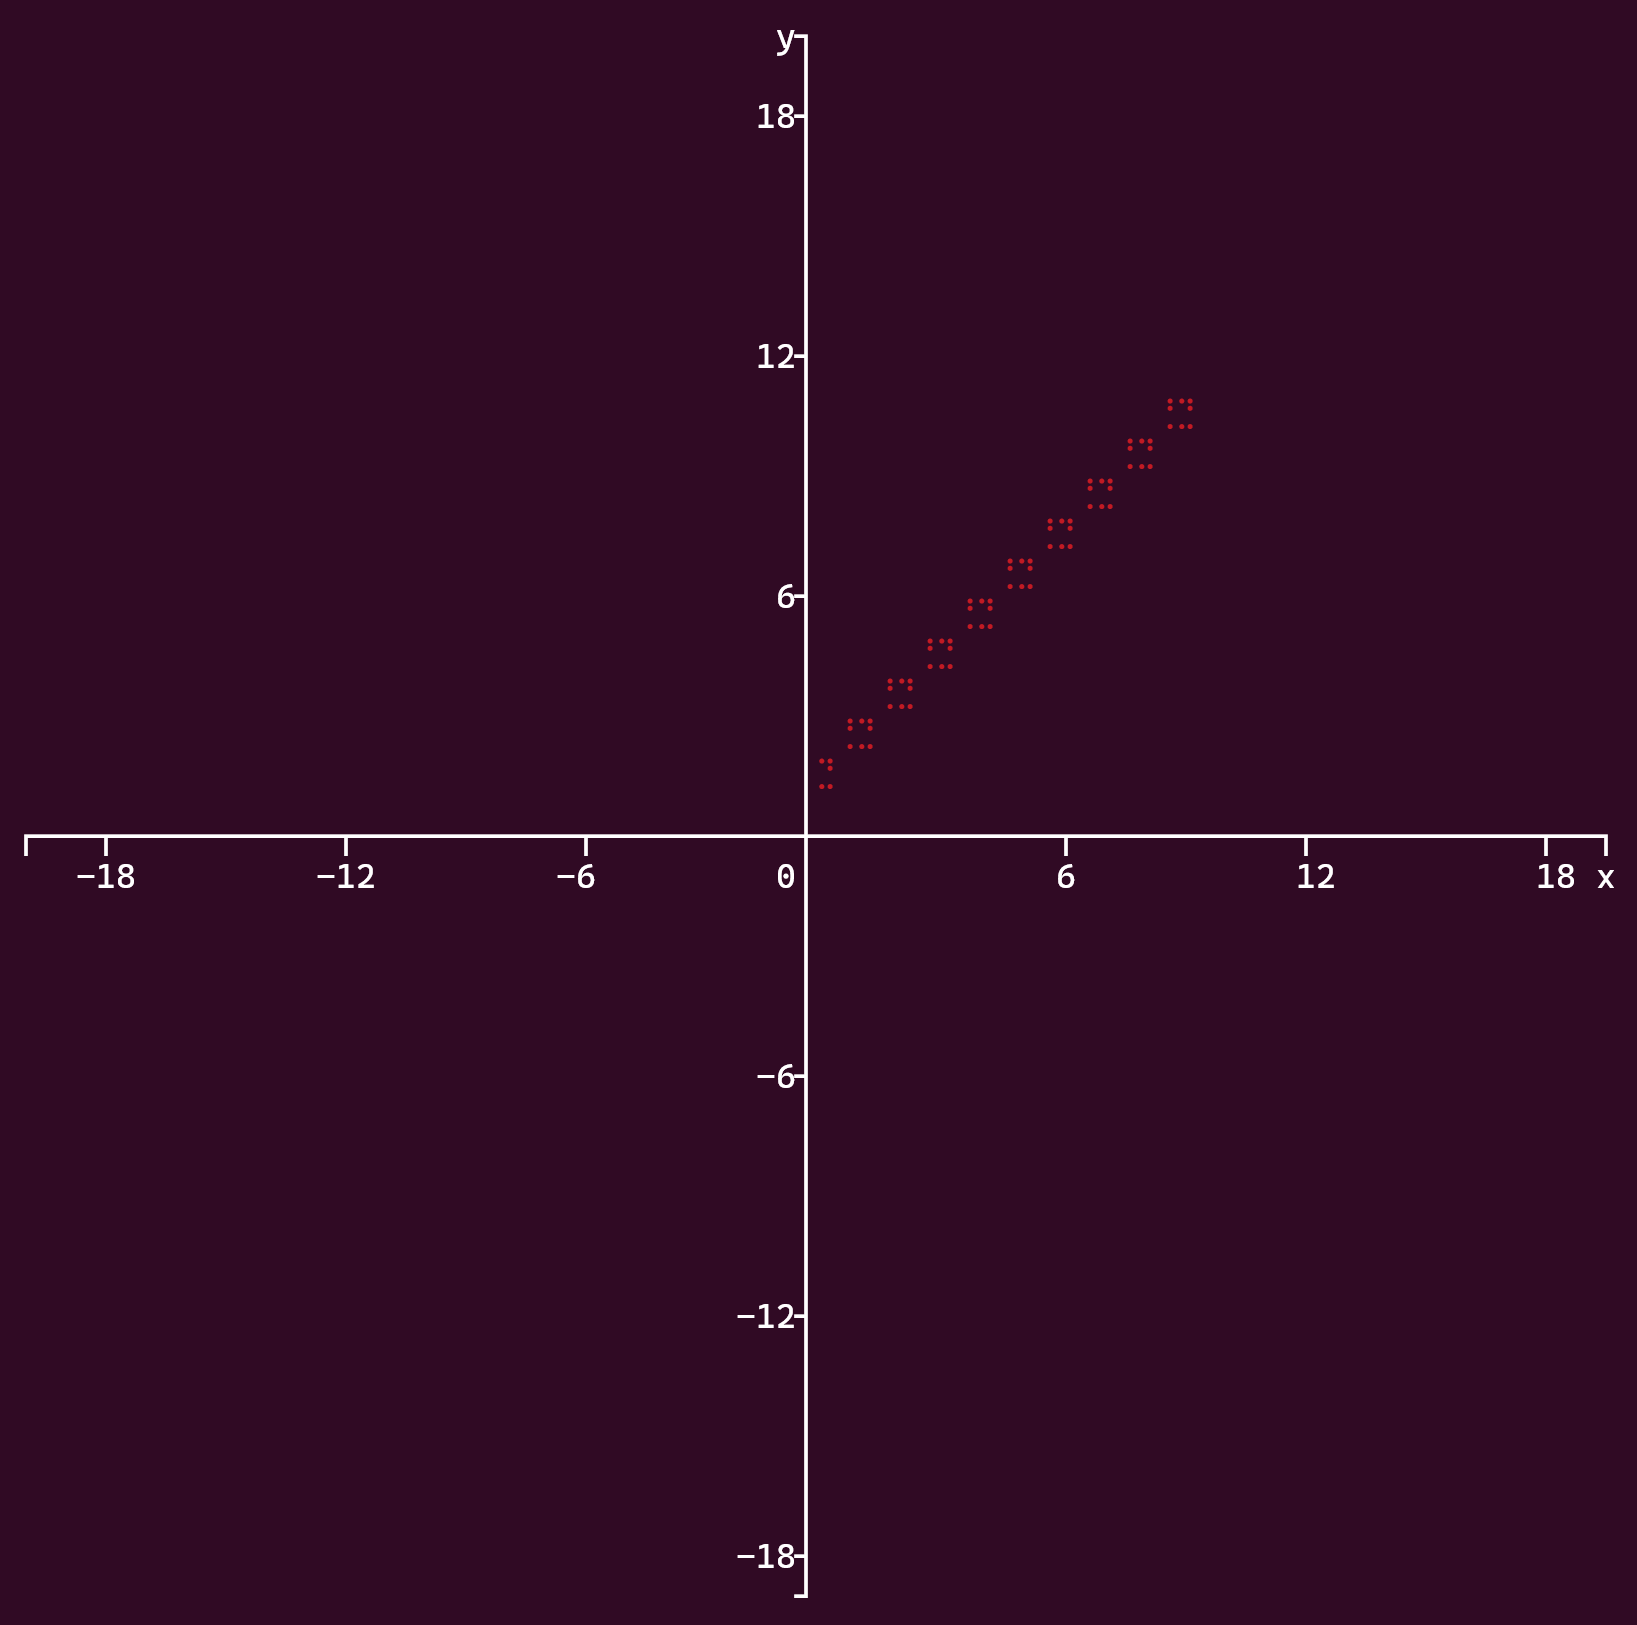
The dot mark type uses a single pixel per mark, the plus uses five pixels and the square uses eight pixels. This option is only used for plots and graphs.
Title
Option: title
Default value: None
The title is output at the top of the graph. It is word wrapped based on the current width of the terminal. Handles newlines, tabs and Unicode characters.
Axis/Border style
Option: style
Values:
style_types.ASCII: ASCII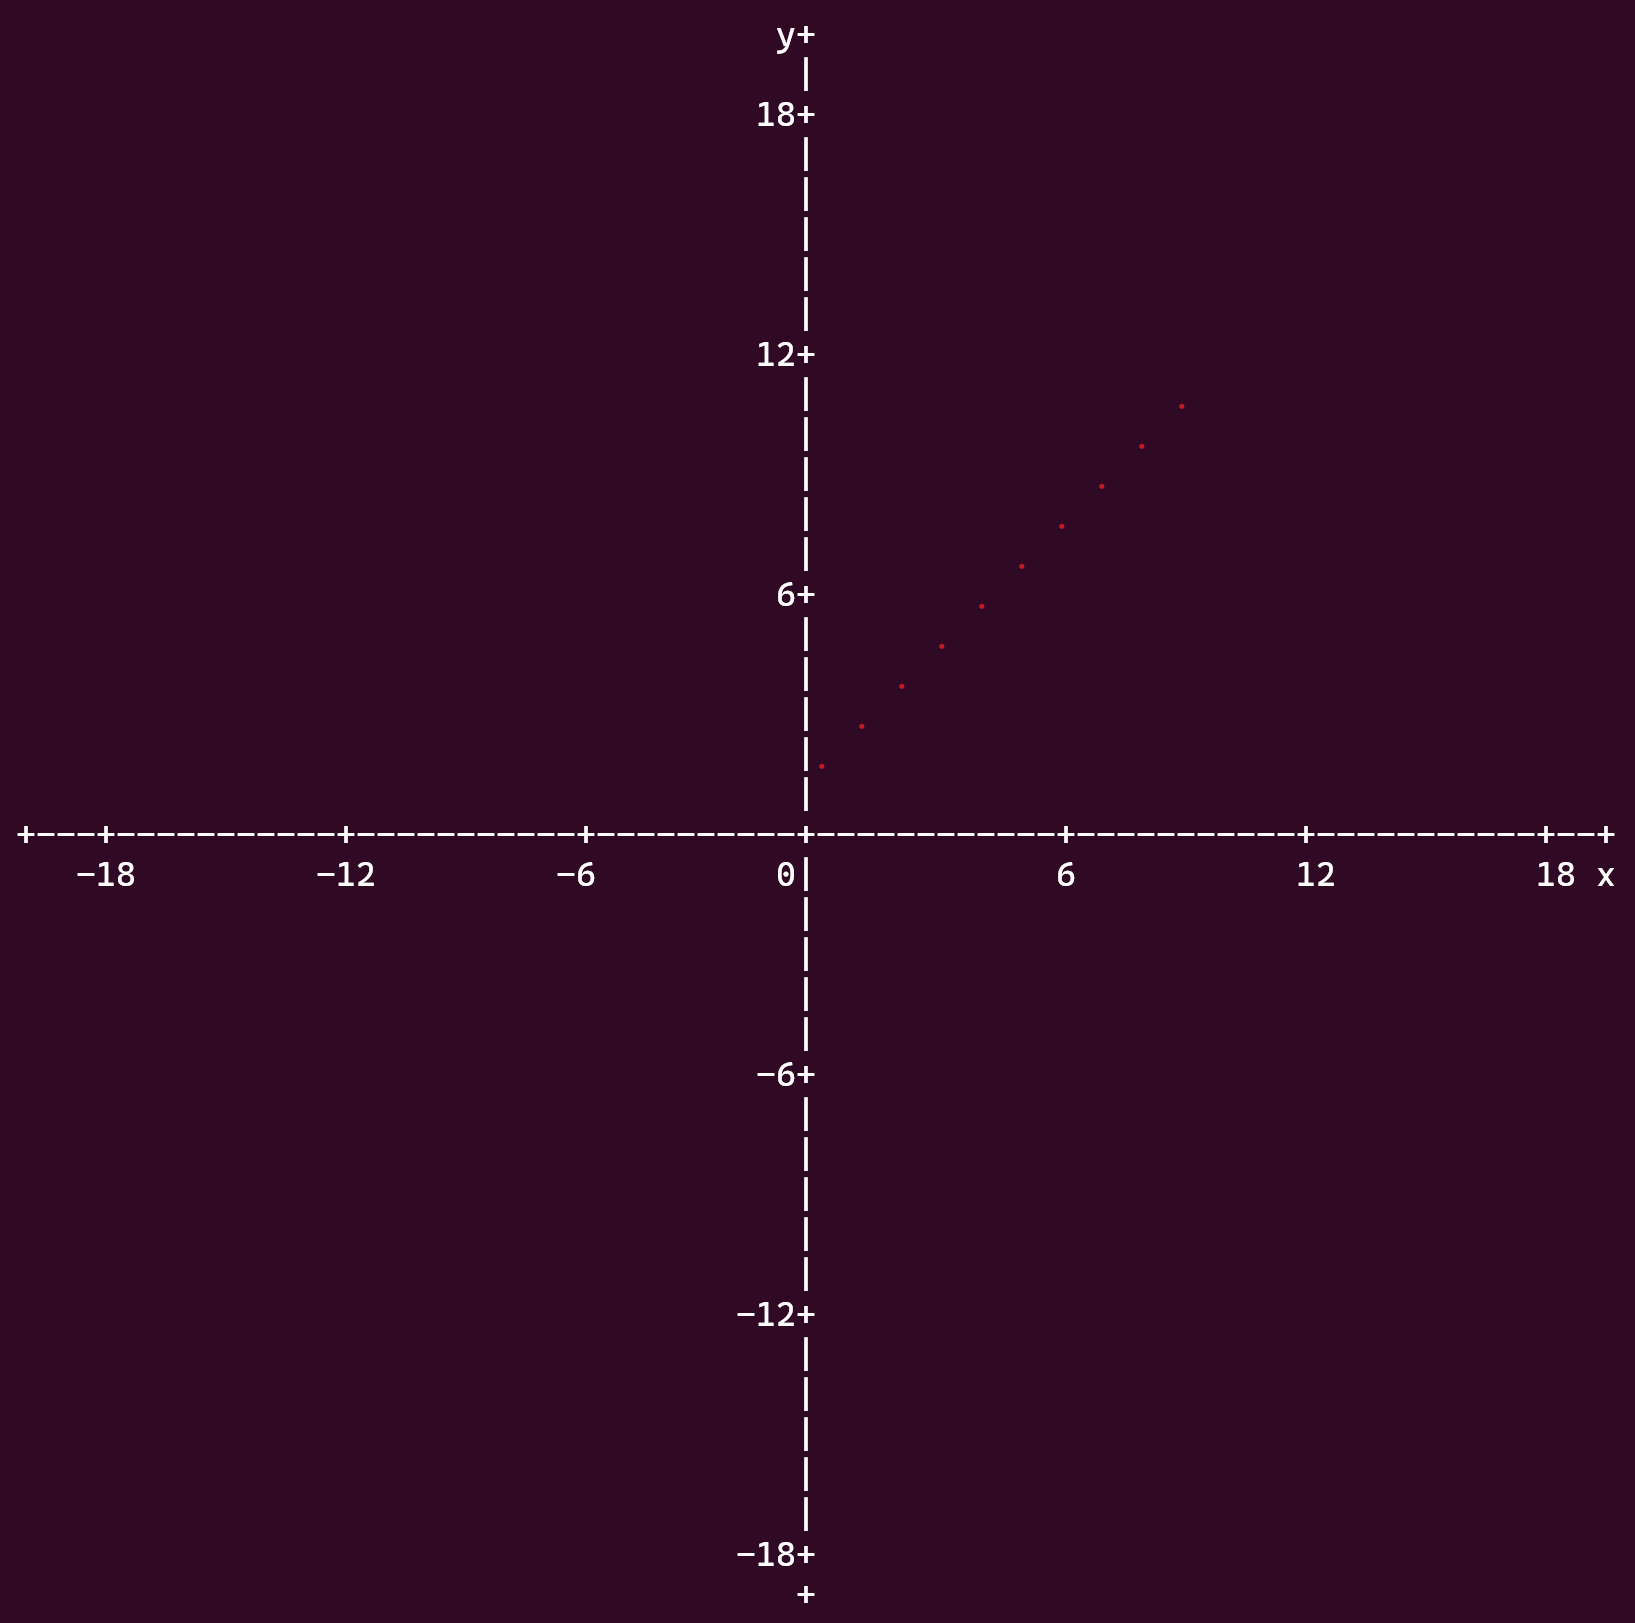
style_types.basic: Basic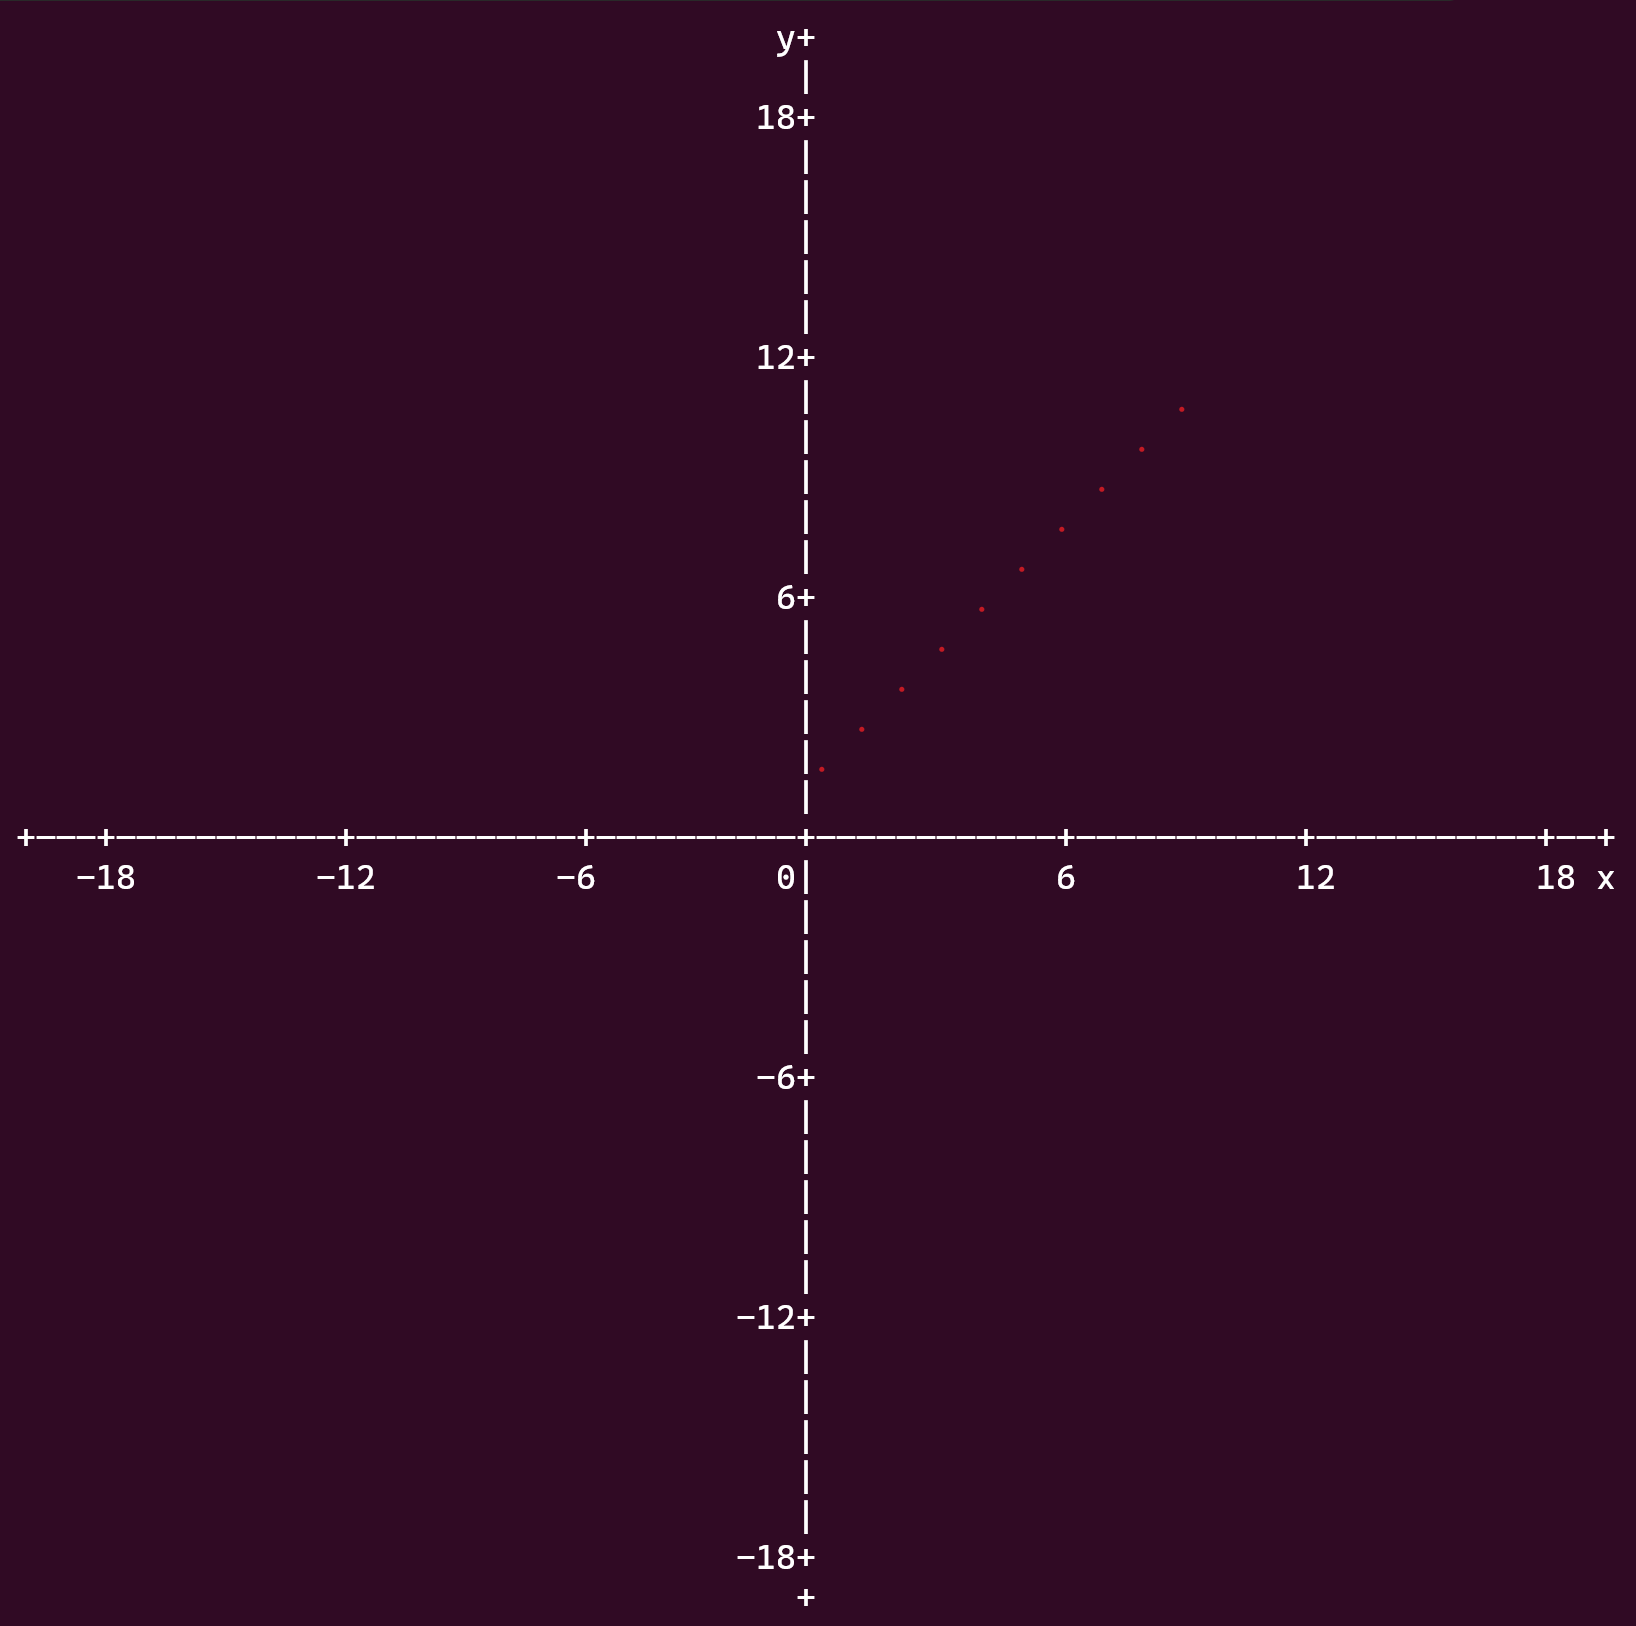
style_types.light: Light (default)
style_types.heavy: Heavy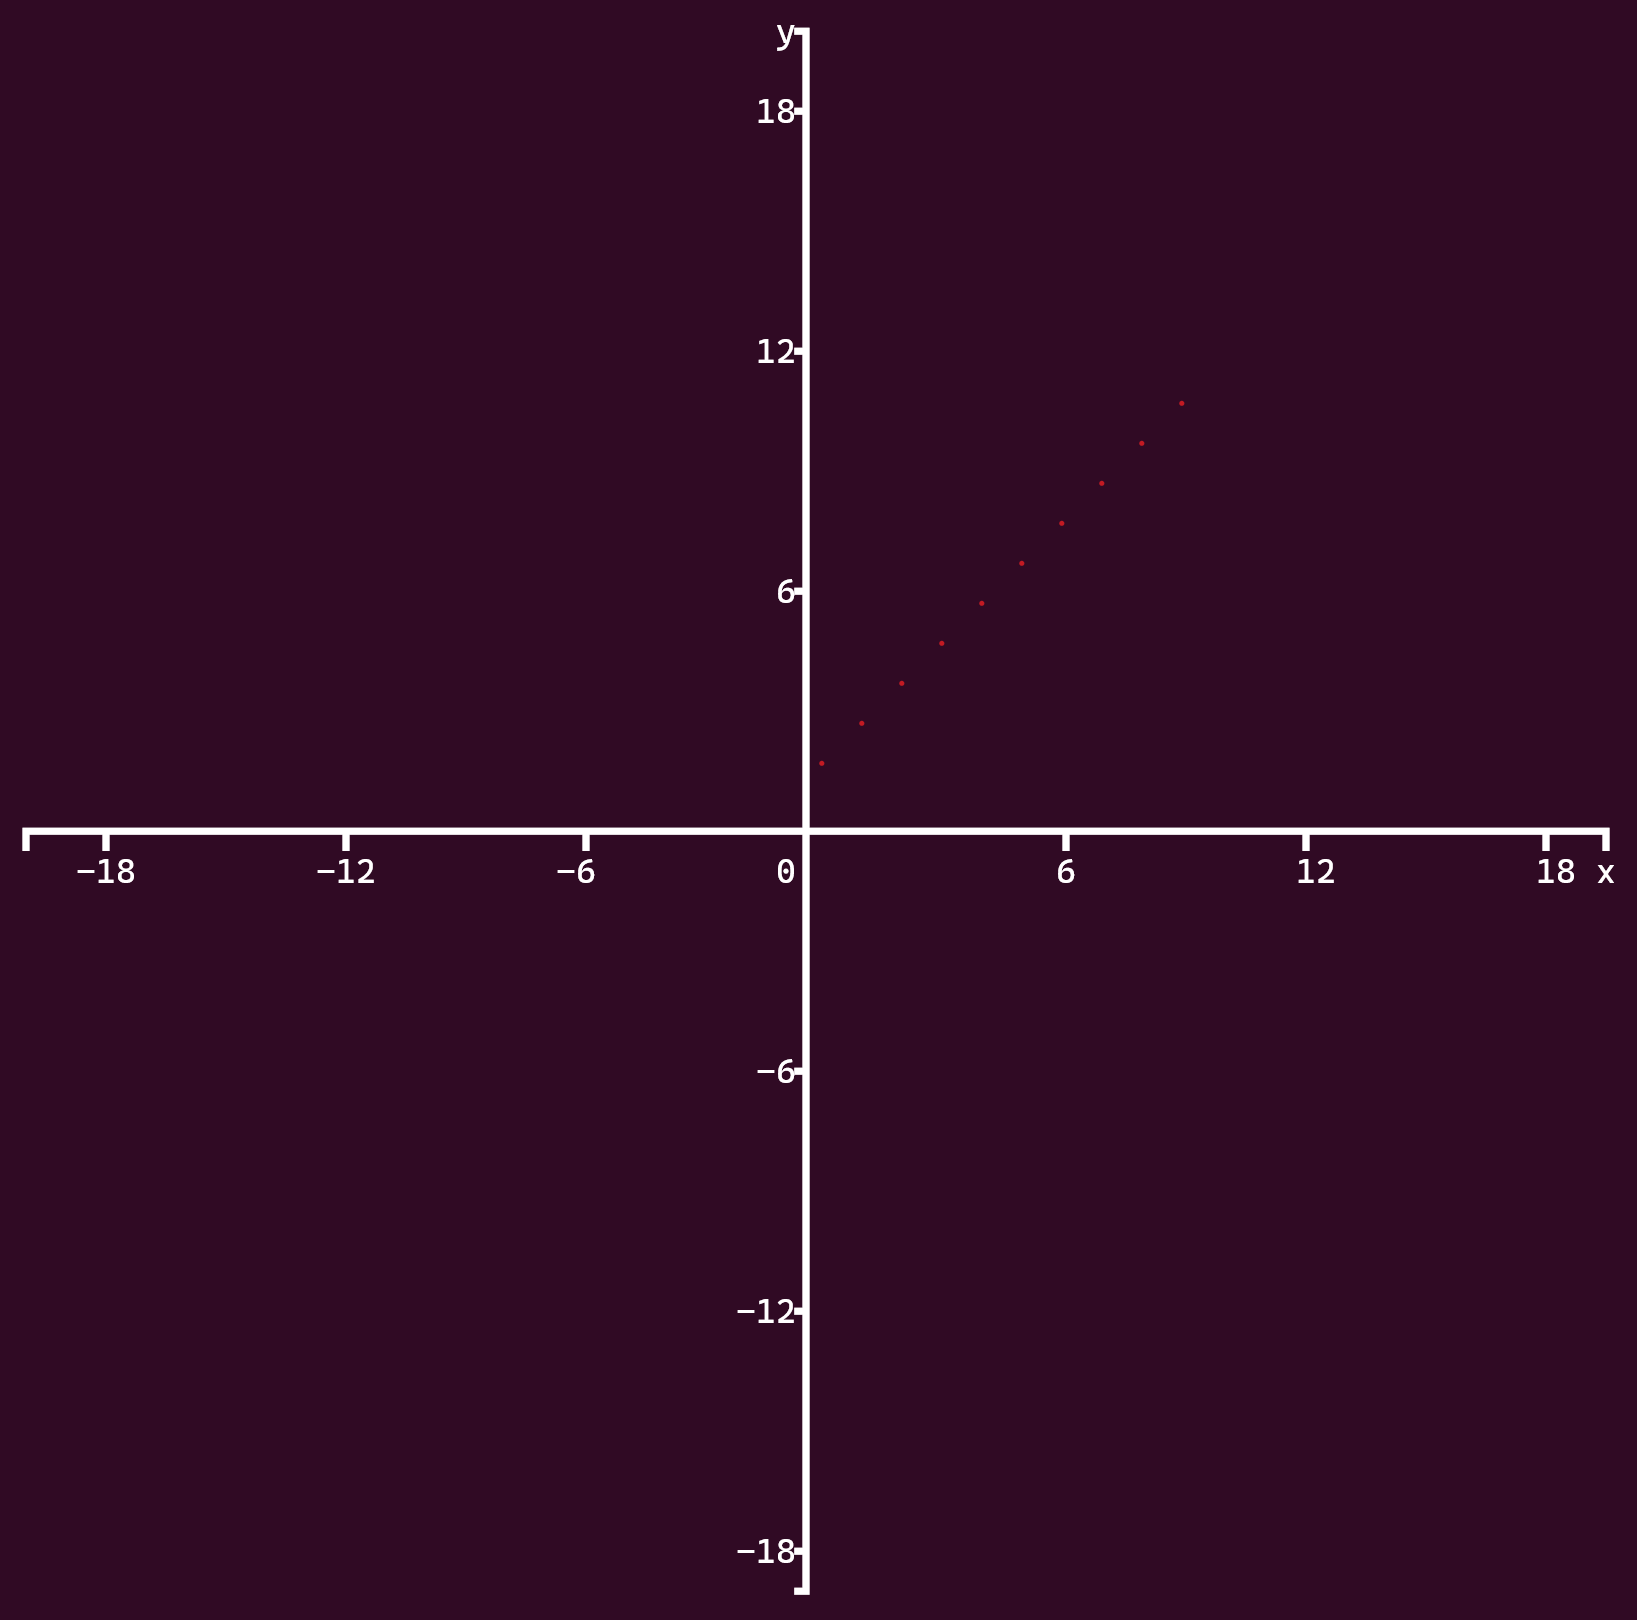
style_types.double: Double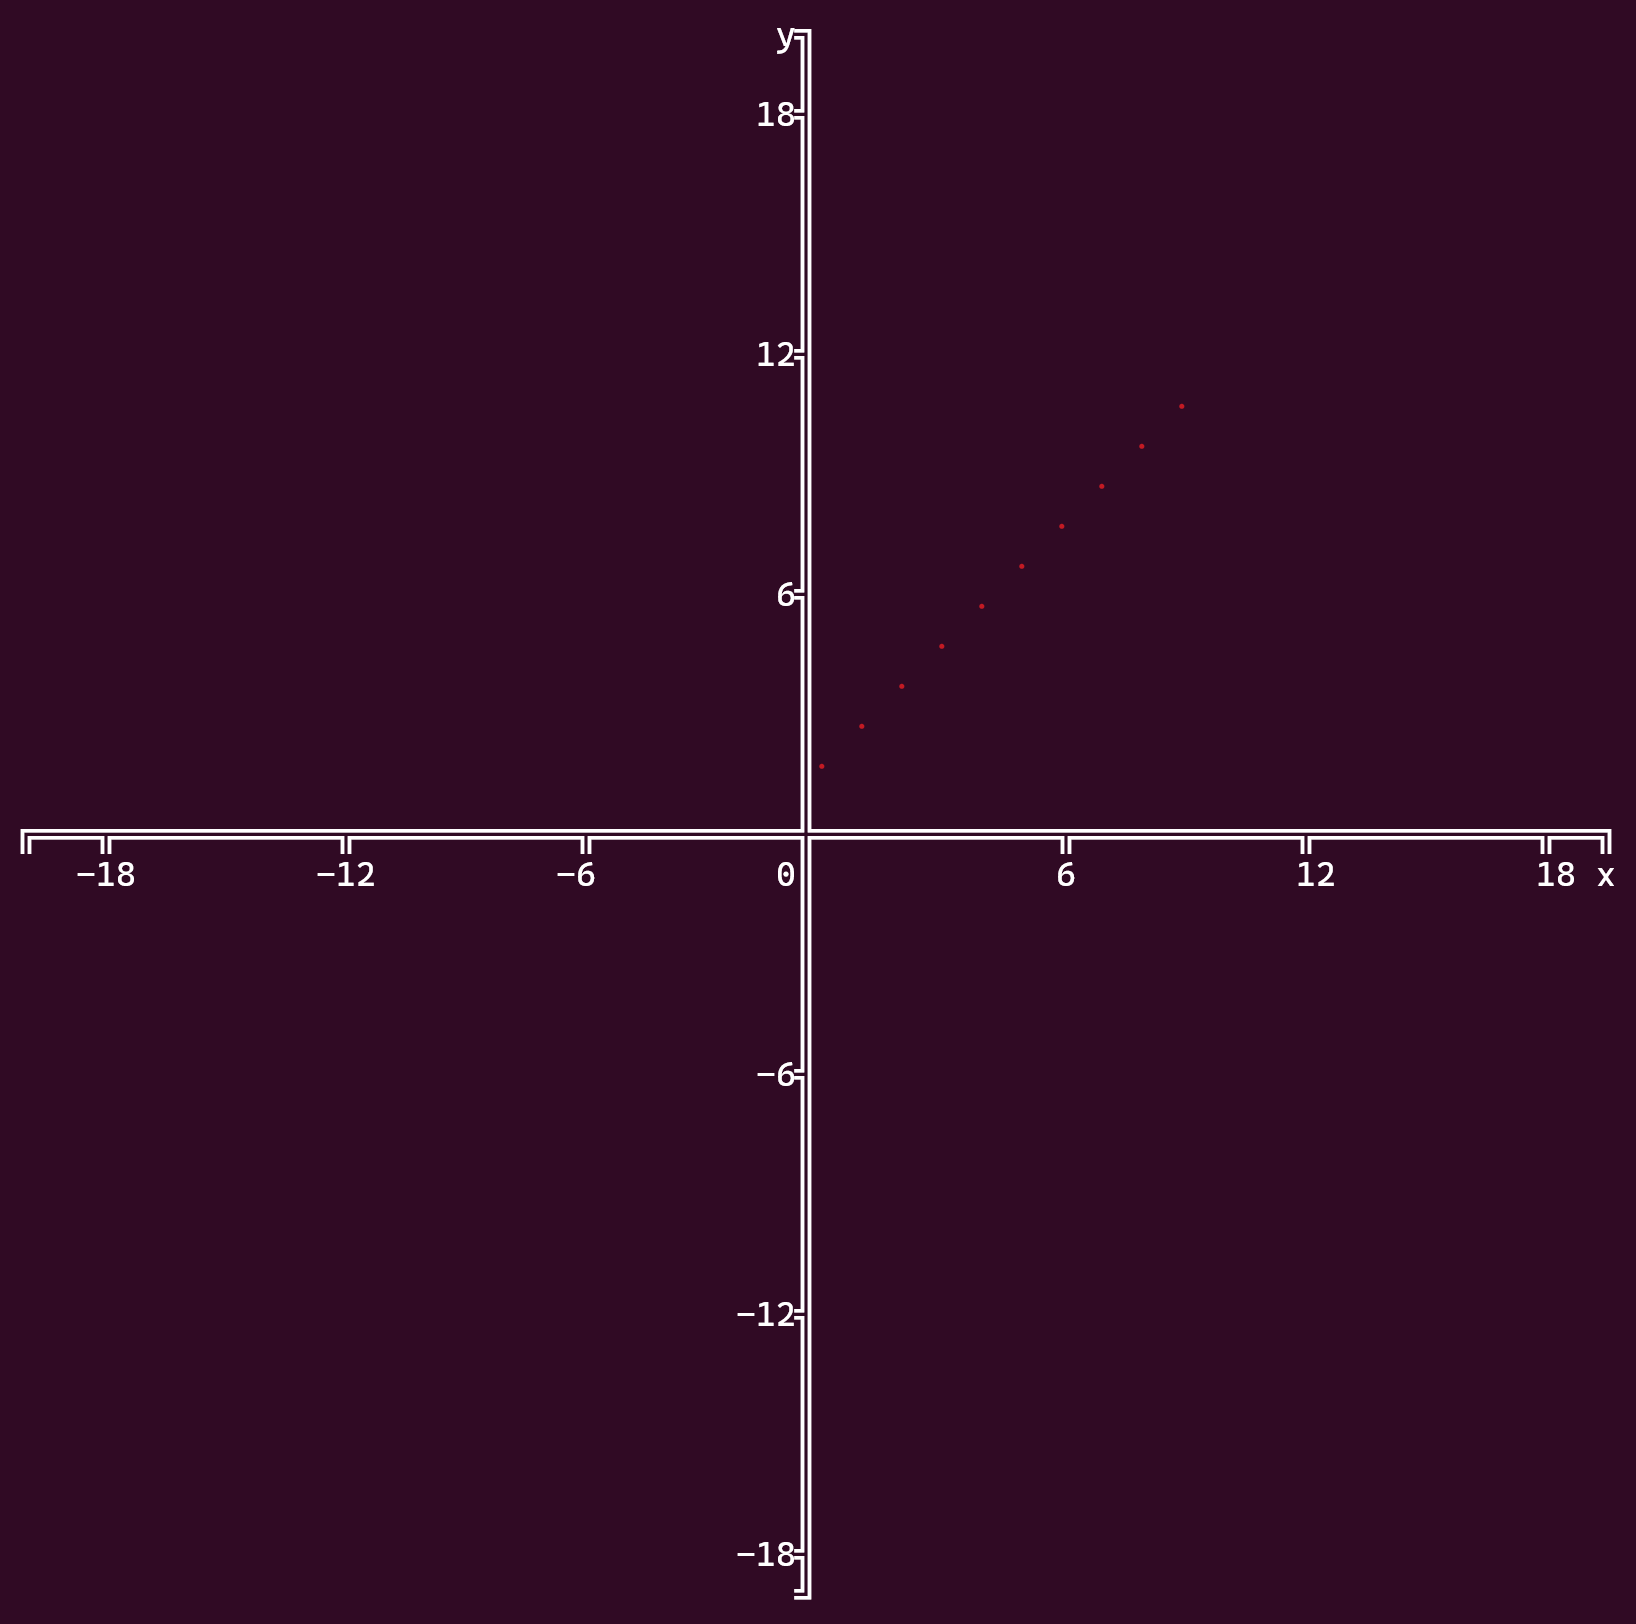
style_types.arc: Light Arc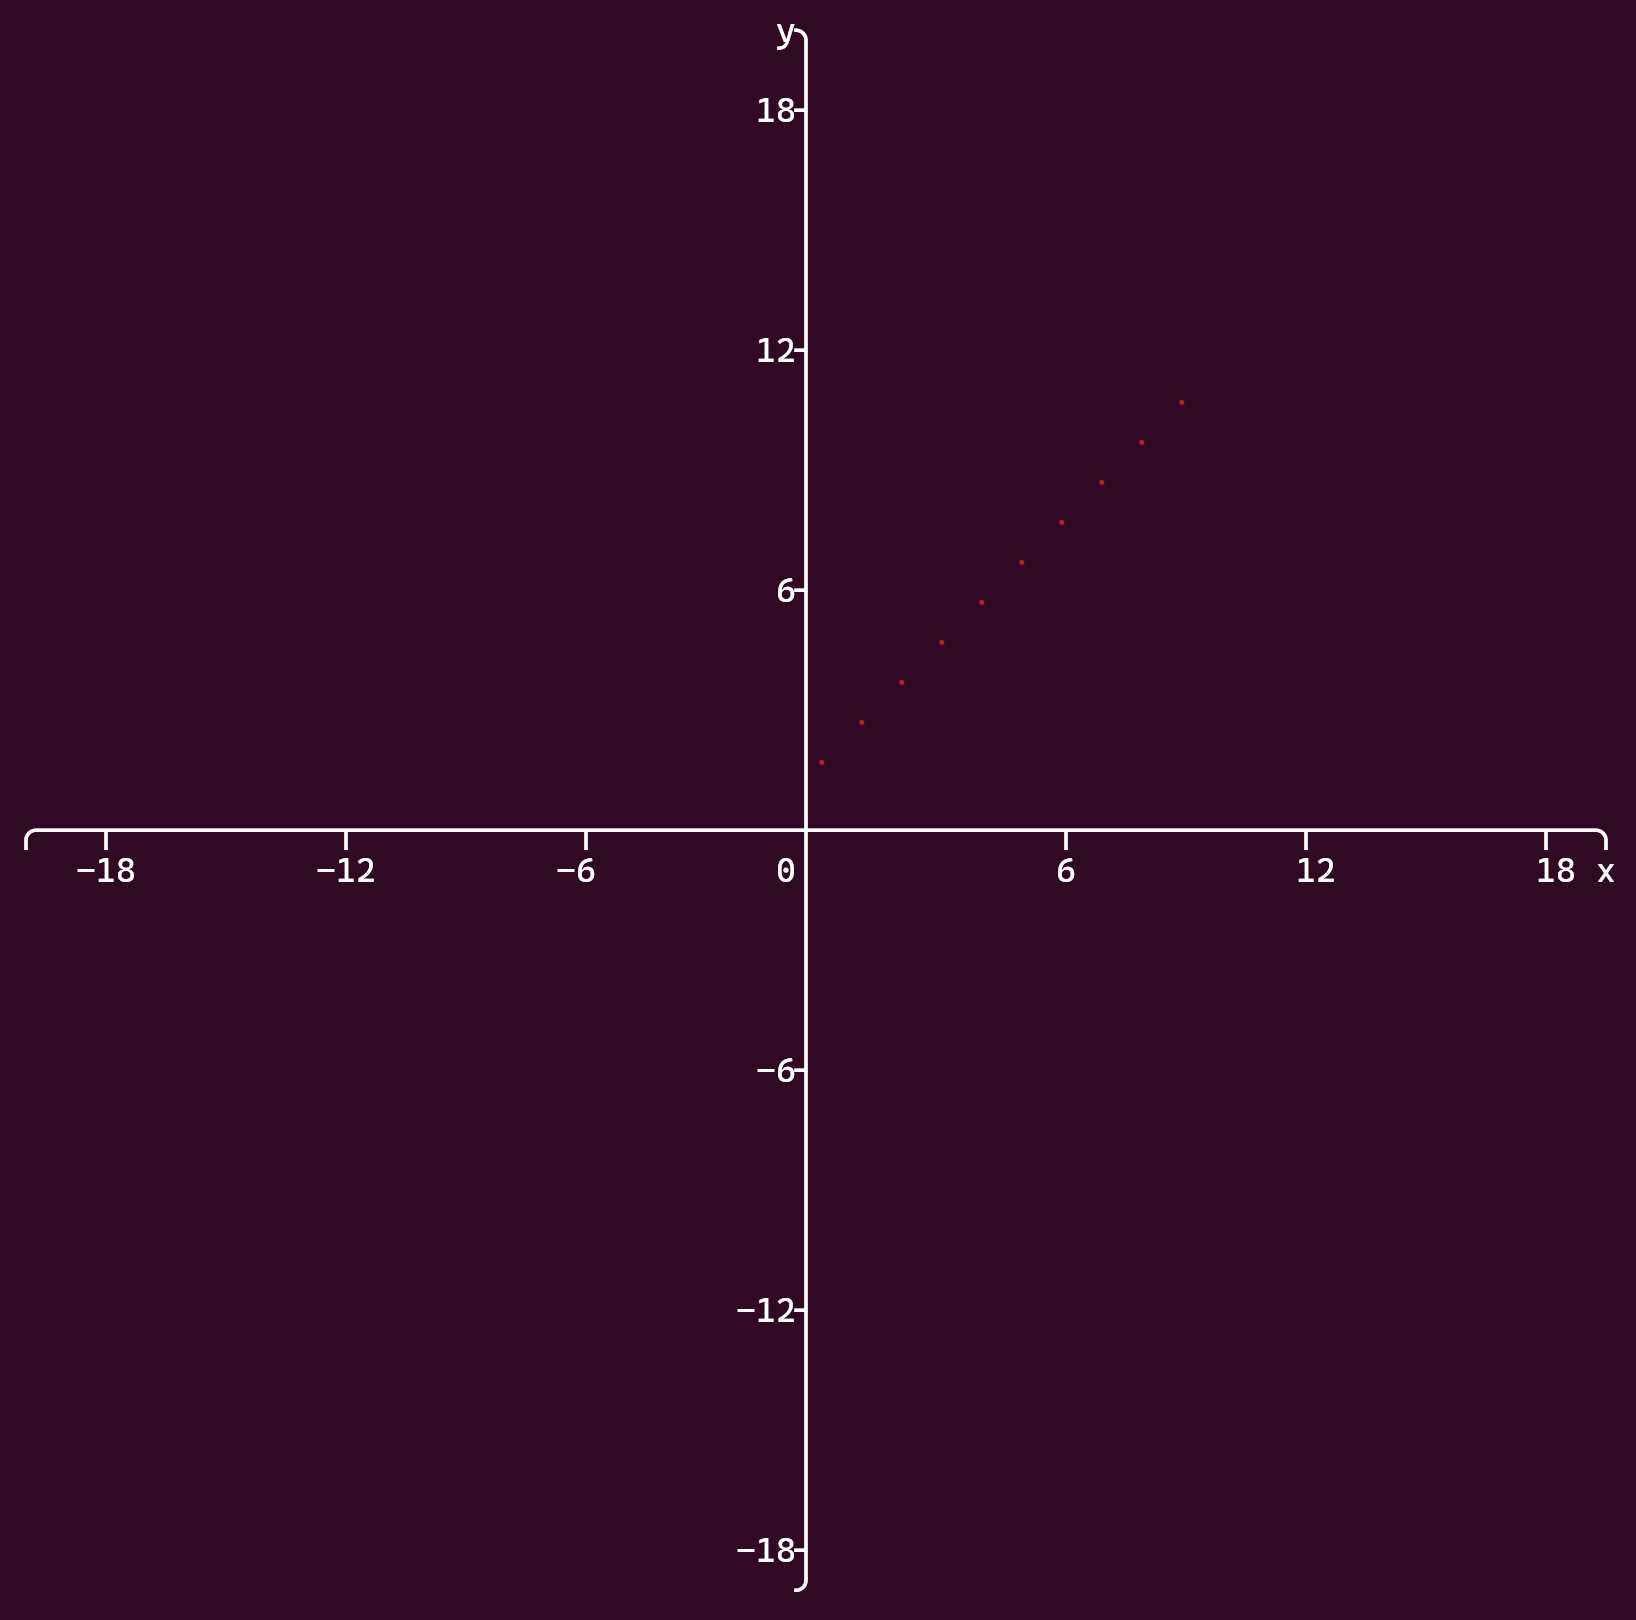
style_types.light_dashed: Light Dashed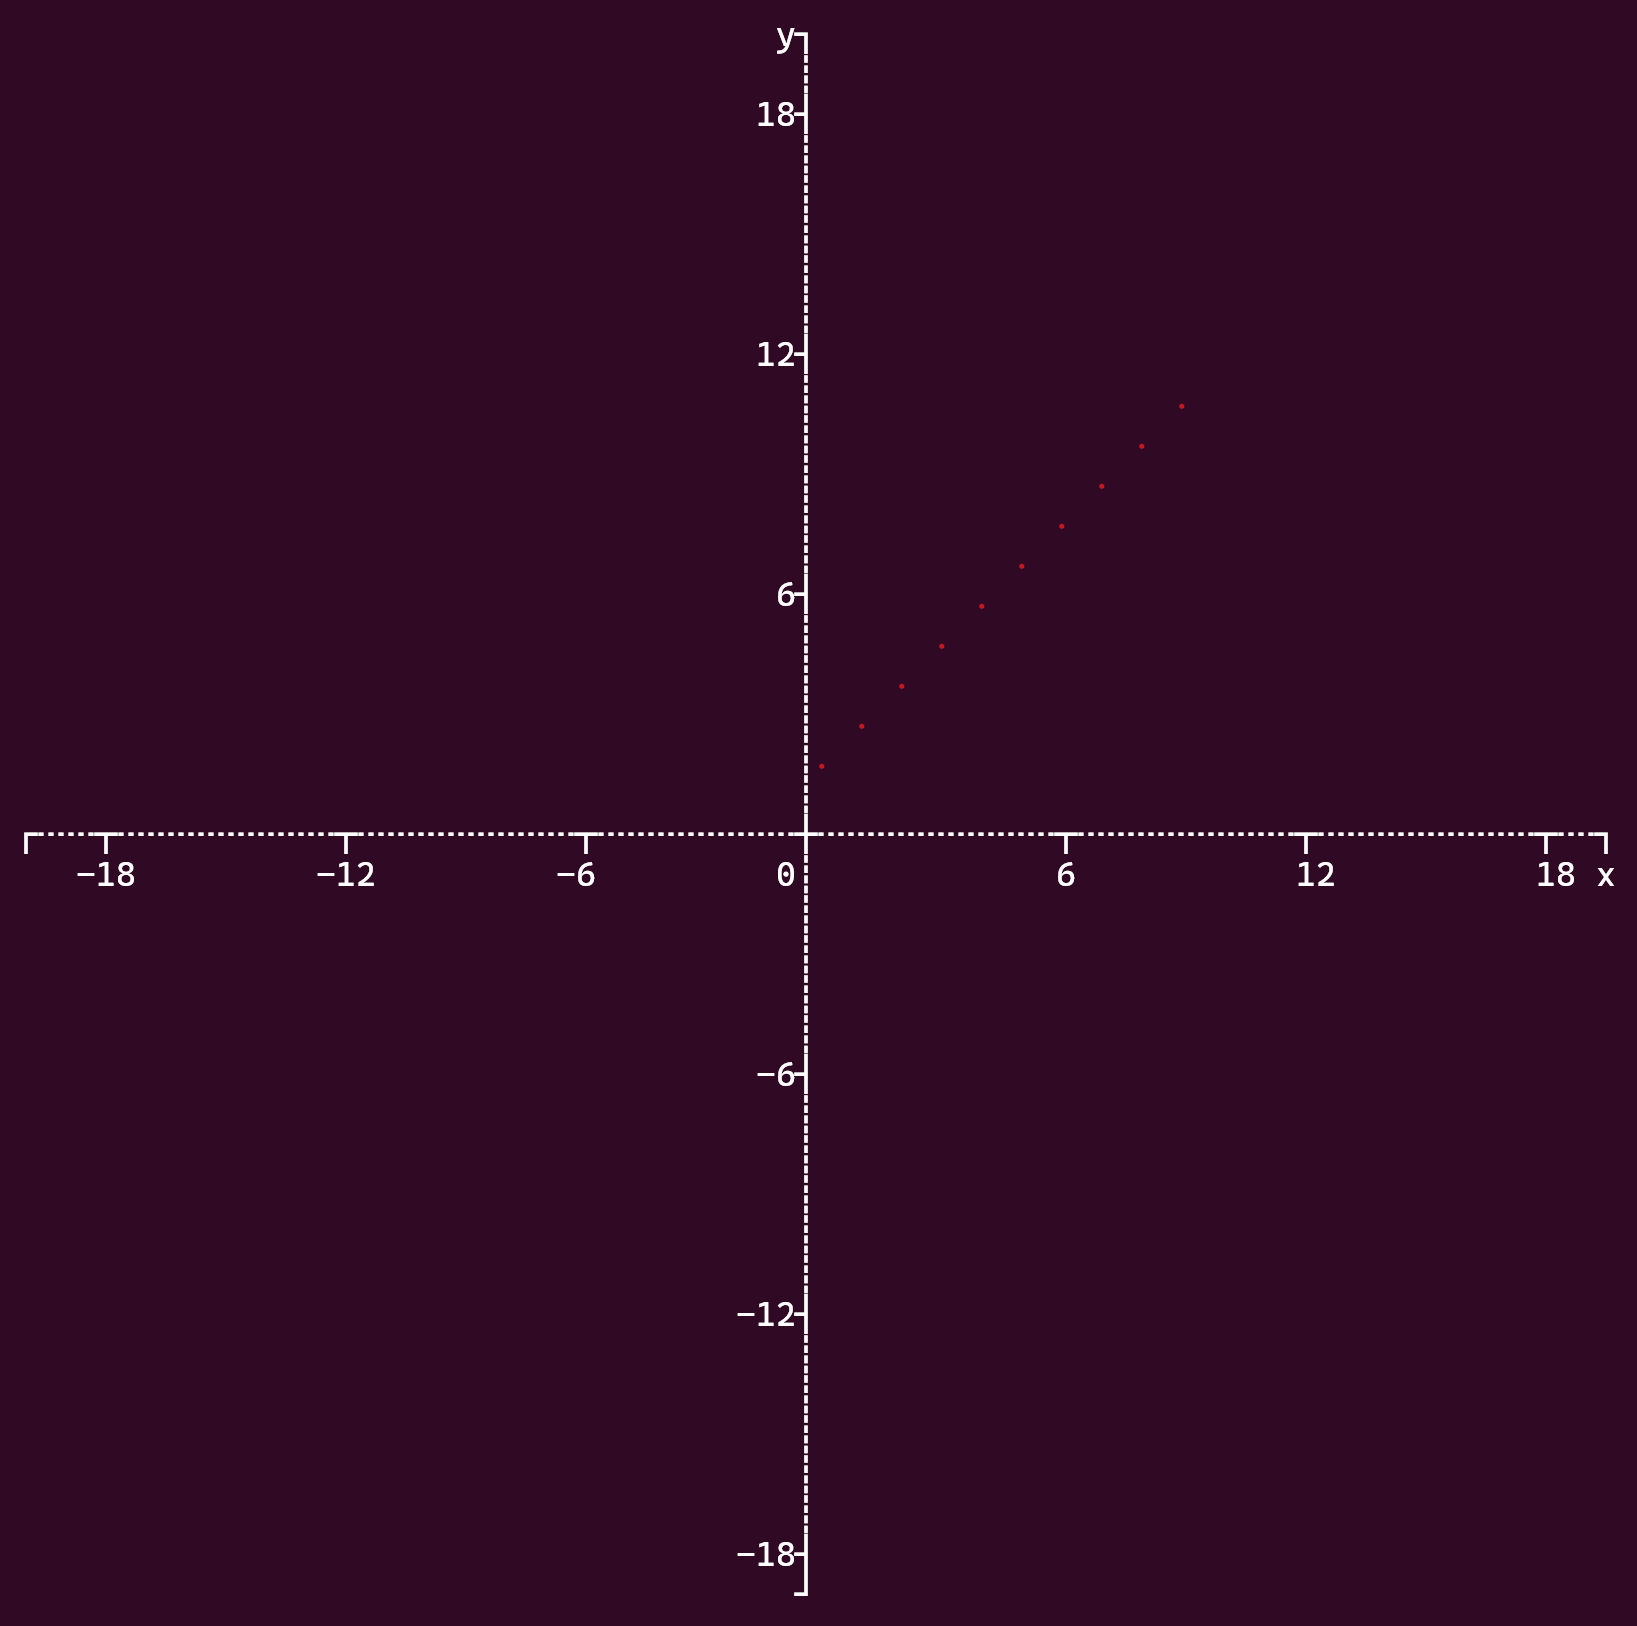
style_types.heavy_dashed: Heavy Dashed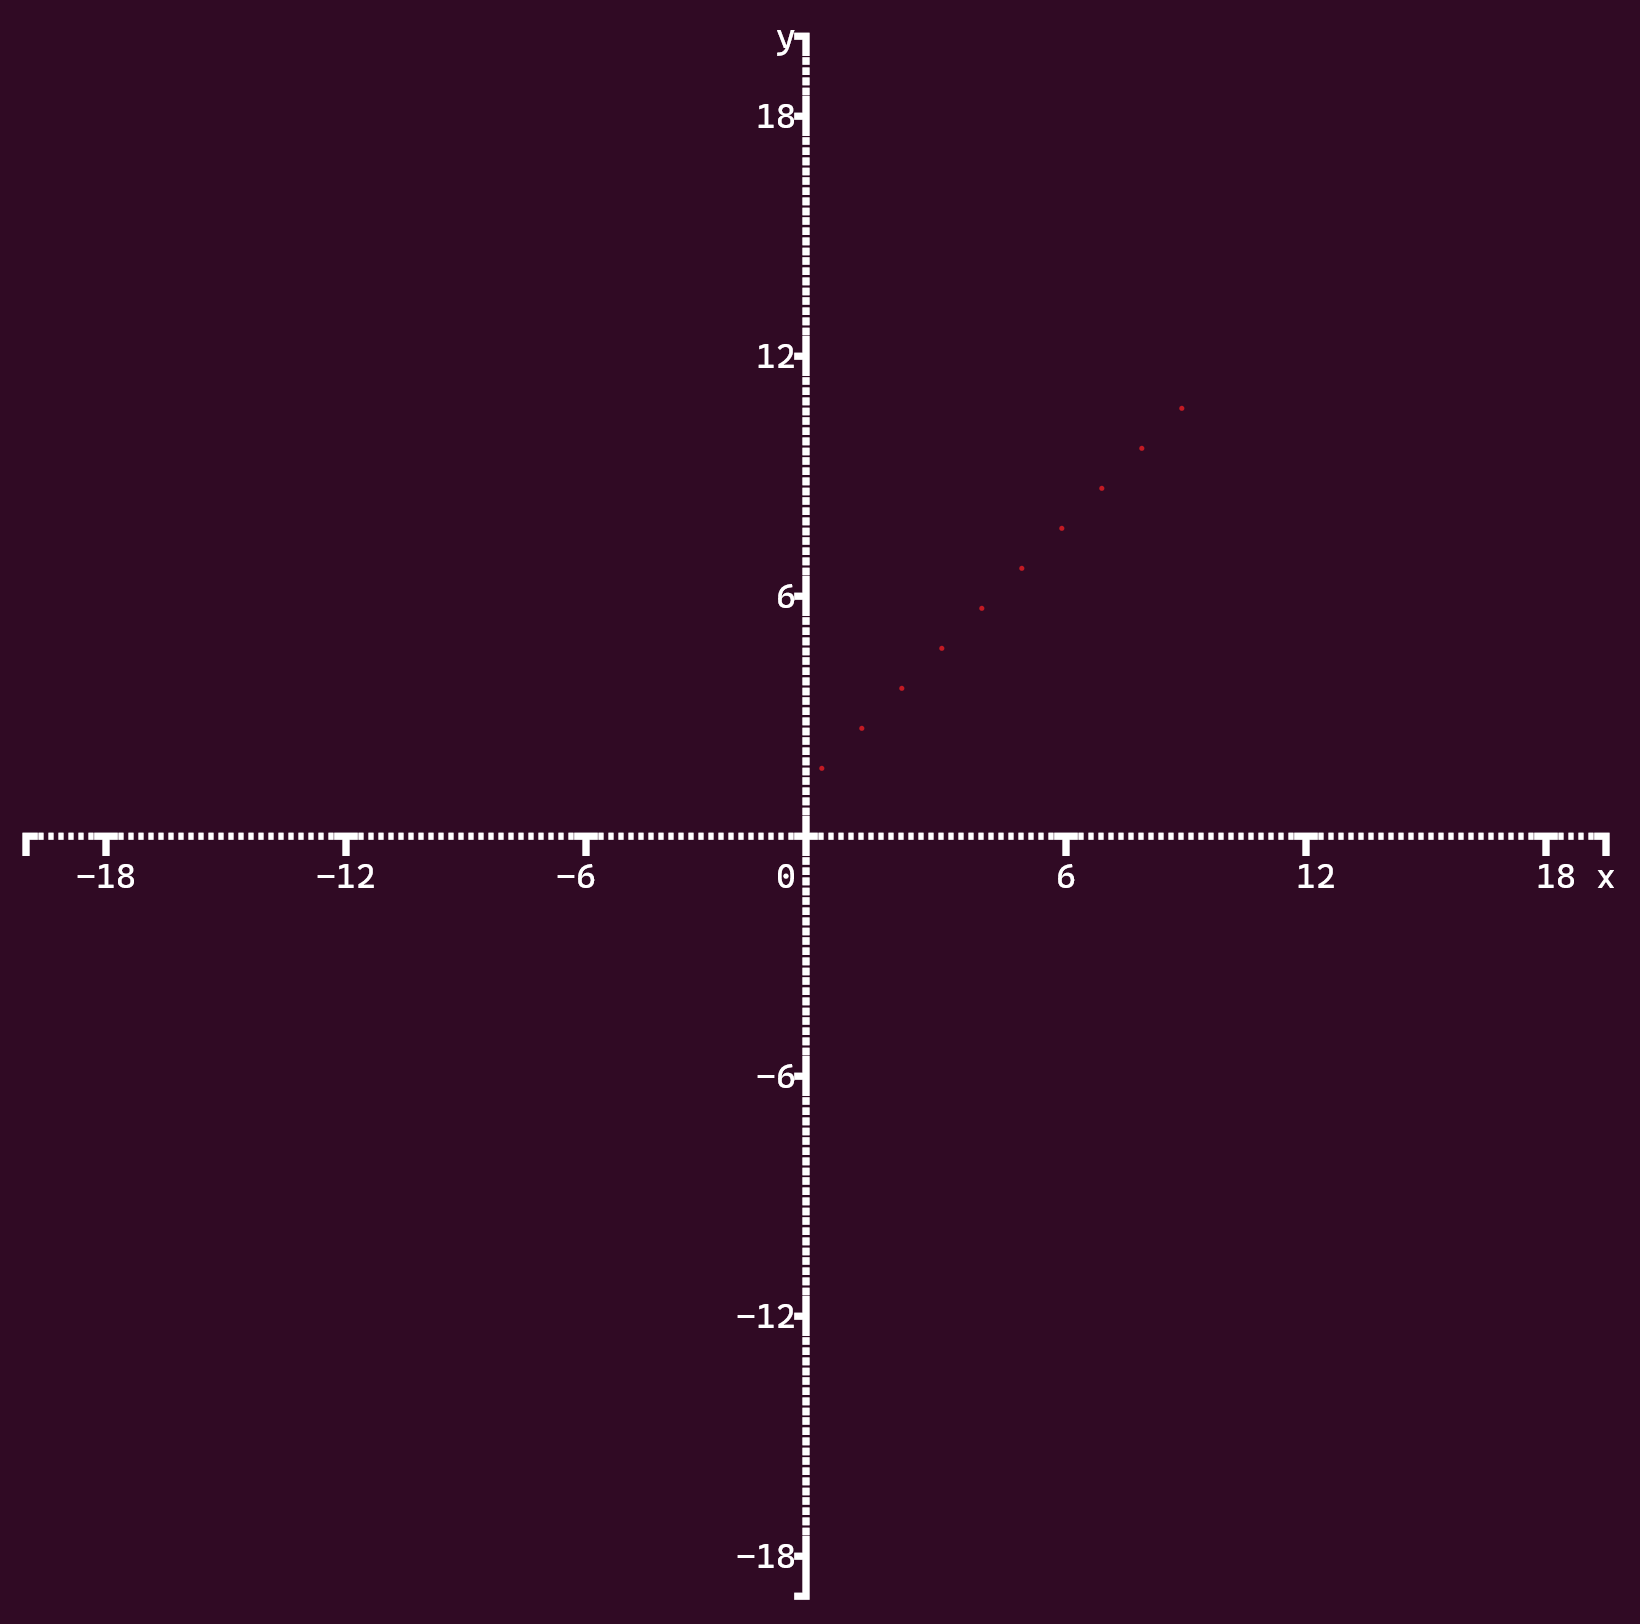
Graph/Plot Color
Option: color
Values:
color_types.default: System defaultcolor_types.black: Blackcolor_types.red: Red (default)color_types.green: Greencolor_types.yellow: Yellowcolor_types.blue: Bluecolor_types.magenta: Magentacolor_types.cyan: Cyancolor_types.white: Whitecolor_types.gray: Graycolor_types.bright_red: Bright Redcolor_types.bright_green: Bright Greencolor_types.bright_yellow: Bright Yellowcolor_types.bright_blue: Bright Bluecolor_types.bright_magenta: Bright Magentacolor_types.bright_cyan: Bright Cyancolor_types.bright_white: Bright White
See here for examples of the colors.
This option is only used when plotting a single array and when graphing a single function. When plotting multiple arrays or graphing multiple functions, colors 2 - 16 are used inorder. The system default color is used where the plots cross.
Plot
Graph
Check size
Option: check
Default value: True
Check that the width and height of the graph are not greater then the respective width and height of the terminal.