mirror of
https://github.com/red-data-tools/YouPlot.git
synced 2025-09-19 02:18:08 +08:00
Compare commits
88 Commits
| Author | SHA1 | Date | |
|---|---|---|---|
|
|
eb317e2bb5 | ||
|
|
edd081562e | ||
|
|
cc076d5cfe | ||
|
|
6f5b73887d | ||
|
|
e18344cc13 | ||
|
|
ae1e7ba44e | ||
|
|
4f78920915 | ||
|
|
115ff6623d | ||
|
|
1b666038bb | ||
|
|
b368dc44b4 | ||
|
|
9581cf730a | ||
|
|
566cee883a | ||
|
|
0aa6de0de5 | ||
|
|
5d1a4fdf3c | ||
|
|
a5cdc94bb0 | ||
|
|
f2b7b94a09 | ||
|
|
1d92ab8e2d | ||
|
|
98e294fae9 | ||
|
|
0af084916e | ||
|
|
dee53a003c | ||
|
|
1a5609022f | ||
|
|
e11b5047af | ||
|
|
9658bfa71c | ||
|
|
f2bd99ed2e | ||
|
|
9849898cb1 | ||
|
|
1a3ad9553c | ||
|
|
ccf232a742 | ||
|
|
eb13f2583f | ||
|
|
1697360b6b | ||
|
|
7034a83dea | ||
|
|
a0c3863b4c | ||
|
|
0ff8c6a9f0 | ||
|
|
7a08d6bab9 | ||
|
|
b72f982618 | ||
|
|
e831fa93f4 | ||
|
|
d85be56521 | ||
|
|
5c59a77054 | ||
|
|
8c78465ce9 | ||
|
|
648e606ed4 | ||
|
|
58ba6bb966 | ||
|
|
b4585b053a | ||
|
|
19c3b0367a | ||
|
|
159b90998b | ||
|
|
a6ff1ebf2e | ||
|
|
f8ea11f0d0 | ||
|
|
406fb80377 | ||
|
|
4d761dd0e7 | ||
|
|
471f0a907e | ||
|
|
552756cadf | ||
|
|
4b4848438c | ||
|
|
6f9c77f4fe | ||
|
|
40304329bc | ||
|
|
2ecaa278c2 | ||
|
|
3ab02e5a05 | ||
|
|
2181e4a0f7 | ||
|
|
7fc7c797af | ||
|
|
942705ab23 | ||
|
|
f7a7dcd1d4 | ||
|
|
d085828883 | ||
|
|
93f8efc60a | ||
|
|
99e9e28ec9 | ||
|
|
54e1865640 | ||
|
|
00c2ce9b44 | ||
|
|
84196c197d | ||
|
|
c40c59a21d | ||
|
|
c4f21df588 | ||
|
|
39166894a3 | ||
|
|
7b8213833f | ||
|
|
9090bbf51b | ||
|
|
428d525c5f | ||
|
|
6ebc707c51 | ||
|
|
c73da80de6 | ||
|
|
2e8641ccea | ||
|
|
1b43f7d48f | ||
|
|
d8396fecf9 | ||
|
|
4660c2ab02 | ||
|
|
d7e49f048f | ||
|
|
34ae2b5815 | ||
|
|
7e8dc6190c | ||
|
|
ba105ab1f3 | ||
|
|
96a1d1feb9 | ||
|
|
2b65dae60c | ||
|
|
943d4e6c44 | ||
|
|
de33805c56 | ||
|
|
de3a366d15 | ||
|
|
4544c0e456 | ||
|
|
ccfbaa7bde | ||
|
|
3aceae9279 |
18
.github/workflows/ci.yml
vendored
Normal file
18
.github/workflows/ci.yml
vendored
Normal file
@@ -0,0 +1,18 @@
|
|||||||
|
name: test
|
||||||
|
on: [push, pull_request]
|
||||||
|
jobs:
|
||||||
|
build:
|
||||||
|
name: ${{ matrix.os }} Ruby ${{ matrix.ruby }}
|
||||||
|
runs-on: ${{ matrix.os }}-latest
|
||||||
|
strategy:
|
||||||
|
matrix:
|
||||||
|
os: ['ubuntu', 'macos']
|
||||||
|
ruby: [ '2.5', '2.6', '2.7' ]
|
||||||
|
steps:
|
||||||
|
- uses: actions/checkout@v2
|
||||||
|
- uses: actions/setup-ruby@v1
|
||||||
|
with:
|
||||||
|
ruby-version: ${{ matrix.ruby }}
|
||||||
|
- run: gem install bundler
|
||||||
|
- run: bundle install
|
||||||
|
- run: bundle exec rake test
|
||||||
@@ -1,7 +0,0 @@
|
|||||||
language: ruby
|
|
||||||
rvm: 2.7
|
|
||||||
script: bundle exec rake test
|
|
||||||
notifications:
|
|
||||||
email:
|
|
||||||
on_success: never
|
|
||||||
on_failure: change
|
|
||||||
2
Gemfile
2
Gemfile
@@ -2,5 +2,5 @@
|
|||||||
|
|
||||||
source 'https://rubygems.org'
|
source 'https://rubygems.org'
|
||||||
|
|
||||||
# Specify your gem's dependencies in uplot.gemspec
|
# Specify your gem's dependencies in youplot.gemspec
|
||||||
gemspec
|
gemspec
|
||||||
|
|||||||
222
README.md
222
README.md
@@ -1,67 +1,199 @@
|
|||||||
# uplot
|

|
||||||
|
|
||||||
[](https://travis-ci.com/kojix2/uplot)
|

|
||||||
[](https://badge.fury.io/rb/u-plot)
|
[](https://badge.fury.io/rb/youplot)
|
||||||
[](https://rubydoc.info/gems/u-plot)
|
[](https://rubydoc.info/gems/youplot)
|
||||||
[](LICENSE.txt)
|
[](LICENSE.txt)
|
||||||
|
[](https://zenodo.org/badge/latestdoi/283230219)
|
||||||
|
|
||||||
Create ASCII charts on the terminal with data from standard streams in the pipeline.
|
YouPlot is a command line tool for Unicode Plotting working with data from standard stream.
|
||||||
|
|
||||||
:bar_chart: Powered by [UnicodePlot](https://github.com/red-data-tools/unicode_plot.rb)
|
:bar_chart: Powered by [UnicodePlot](https://github.com/red-data-tools/unicode_plot.rb)
|
||||||
|
|
||||||
:construction: Under development! :construction:
|
|
||||||
|
|
||||||
## Installation
|
## Installation
|
||||||
|
|
||||||
```
|
```
|
||||||
gem install u-plot
|
gem install youplot
|
||||||
|
```
|
||||||
|
|
||||||
|
## Quick Start
|
||||||
|
|
||||||
|
`cat data.tsv | uplot <command> [options]`
|
||||||
|
|
||||||
|
### barplot
|
||||||
|
|
||||||
|
```sh
|
||||||
|
curl -sL https://git.io/ISLANDScsv \
|
||||||
|
| sort -nk2 -t, \
|
||||||
|
| tail -n15 \
|
||||||
|
| uplot bar -d, -t "Areas of the World's Major Landmasses"
|
||||||
|
```
|
||||||
|
|
||||||
|

|
||||||
|
|
||||||
|
### histogram
|
||||||
|
|
||||||
|
```sh
|
||||||
|
echo -e "from numpy import random;" \
|
||||||
|
"n = random.randn(10000);" \
|
||||||
|
"print('\\\n'.join(str(i) for i in n))" \
|
||||||
|
| python \
|
||||||
|
| uplot hist --nbins 20
|
||||||
|
```
|
||||||
|

|
||||||
|
|
||||||
|
### lineplot
|
||||||
|
|
||||||
|
```sh
|
||||||
|
curl -sL https://git.io/AirPassengers \
|
||||||
|
| cut -f2,3 -d, \
|
||||||
|
| uplot line -d, -w 50 -h 15 -t AirPassengers --xlim 1950,1960 --ylim 0,600
|
||||||
|
```
|
||||||
|
|
||||||
|

|
||||||
|
|
||||||
|
### scatter
|
||||||
|
|
||||||
|
```sh
|
||||||
|
curl -sL https://git.io/IRIStsv \
|
||||||
|
| cut -f1-4 \
|
||||||
|
| uplot scatter -H -t IRIS
|
||||||
|
```
|
||||||
|
|
||||||
|

|
||||||
|
|
||||||
|
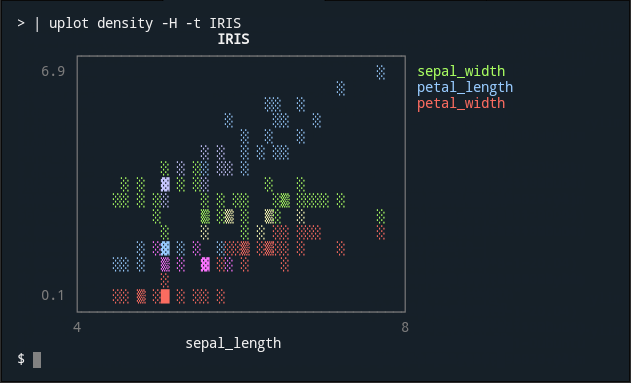
### density
|
||||||
|
|
||||||
|
```sh
|
||||||
|
curl -sL https://git.io/IRIStsv \
|
||||||
|
| cut -f1-4 \
|
||||||
|
| uplot density -H -t IRIS
|
||||||
|
```
|
||||||
|
|
||||||
|
|
||||||
|
|
||||||
|
### boxplot
|
||||||
|
|
||||||
|
```sh
|
||||||
|
curl -sL https://git.io/IRIStsv \
|
||||||
|
| cut -f1-4 \
|
||||||
|
| uplot boxplot -H -t IRIS
|
||||||
|
```
|
||||||
|
|
||||||
|

|
||||||
|
|
||||||
|
### count
|
||||||
|
|
||||||
|
In this example, YouPlot counts the number of chromosomes where the gene is located from the human gene annotation file and create a bar chart. The human gene annotation file can be downloaded from the following website.
|
||||||
|
|
||||||
|
* https://www.gencodegenes.org/human/
|
||||||
|
|
||||||
|
```sh
|
||||||
|
cat gencode.v35.annotation.gff3 \
|
||||||
|
| grep -v '#' | grep 'gene' | cut -f1 | \
|
||||||
|
uplot count -t "The number of human gene annotations per chromosome" -c blue
|
||||||
|
```
|
||||||
|
|
||||||
|

|
||||||
|
|
||||||
|
Note: `count` is not very fast because it runs in a Ruby script.
|
||||||
|
This is fine if the data is small, that is, in most cases. However, if you want to visualize huge data, it is faster to use a combination of common Unix commands as shown below.
|
||||||
|
|
||||||
|
```sh
|
||||||
|
cat gencode.v35.annotation.gff3 | grep -v '#' | grep 'gene' | cut -f1 \
|
||||||
|
|sort | uniq -c | sort -nrk2 | awk '{print $2,$1}' \
|
||||||
|
| uplot bar -d ' ' -t "The number of human gene annotations per chromosome" -c blue
|
||||||
```
|
```
|
||||||
|
|
||||||
## Usage
|
## Usage
|
||||||
|
|
||||||
**histogram**
|
### Why YouPlot?
|
||||||
|
|
||||||
|
Wouldn't it be a bit of pain to have to run R, Python, Julia, gnuplot or whatever REPL just to check your data?
|
||||||
|
YouPlot is a command line tool for this purpose. With YouPlot, you can continue working without leaving your terminal and shell.
|
||||||
|
|
||||||
|
### how to use YouPlot?
|
||||||
|
|
||||||
|
`uplot` is the shortened form of `youplot`. You can use either.
|
||||||
|
|
||||||
|
| | |
|
||||||
|
|-----------------------------------|------------------------------------------------|
|
||||||
|
| Reads data from standard input | `cat data.tsv \| uplot <command> [options]` |
|
||||||
|
| Reads data from files | `uplot <command> [options] data.tsv ...` |
|
||||||
|
| Outputs data from stdin to stdout | `pipeline1 \| uplot <command> -O \| pipeline2` |
|
||||||
|
|
||||||
|
### Where to output the plot?
|
||||||
|
|
||||||
|
By default, the plot is output to *standard error output*.
|
||||||
|
The output file or stream for the plot can be specified with the `-o` option.
|
||||||
|
|
||||||
|
### Where to output the input data?
|
||||||
|
|
||||||
|
By default, the input data is not output anywhere.
|
||||||
|
The `-O` option, with no arguments, outputs the input data directly to the standard output. This is useful when passing data to a subsequent pipeline.
|
||||||
|
|
||||||
|
### What types of plots are available?
|
||||||
|
|
||||||
|
The following sub-commands are available
|
||||||
|
|
||||||
|
| command | short | how it works |
|
||||||
|
|-----------|-------|----------------------------------------|
|
||||||
|
| barplot | bar | draw a horizontal barplot |
|
||||||
|
| histogram | hist | draw a horizontal histogram |
|
||||||
|
| lineplot | line | draw a line chart |
|
||||||
|
| lineplots | lines | draw a line chart with multiple series |
|
||||||
|
| scatter | s | draw a scatter plot |
|
||||||
|
| density | d | draw a density plot |
|
||||||
|
| boxplot | box | draw a horizontal boxplot |
|
||||||
|
|
||||||
|
See Quick Start for `count`.
|
||||||
|
|
||||||
|
| command | short | how it works |
|
||||||
|
|-----------|-------|----------------------------------------------------------|
|
||||||
|
| count | c | draw a baplot based on the number of occurrences (slow) |
|
||||||
|
|
||||||
|
### How to view detailed command line options
|
||||||
|
|
||||||
|
Use `--help` to print command-specific options.
|
||||||
|
|
||||||
|
`uplot hist --help`
|
||||||
|
|
||||||
|
```
|
||||||
|
Usage: uplot histogram [options] <in.tsv>
|
||||||
|
|
||||||
|
Options for histogram:
|
||||||
|
--symbol VAL character to be used to plot the bars
|
||||||
|
--closed VAL
|
||||||
|
-n, --nbins VAL approximate number of bins
|
||||||
|
|
||||||
|
Options:
|
||||||
|
...
|
||||||
|
```
|
||||||
|
|
||||||
|
### How to view the list of available colors?
|
||||||
|
|
||||||
```sh
|
```sh
|
||||||
ruby -r numo/narray -e "puts Numo::DFloat.new(1000).rand_norm.to_a" \
|
uplot colors
|
||||||
| uplot hist --nbins 15
|
|
||||||
```
|
```
|
||||||
|
|
||||||
```
|
|
||||||
┌ ┐
|
|
||||||
[-4.5, -4.0) ┤ 1
|
|
||||||
[-4.0, -3.5) ┤ 0
|
|
||||||
[-3.5, -3.0) ┤ 1
|
|
||||||
[-3.0, -2.5) ┤▇▇ 9
|
|
||||||
[-2.5, -2.0) ┤▇▇▇ 15
|
|
||||||
[-2.0, -1.5) ┤▇▇▇▇▇▇▇▇▇ 50
|
|
||||||
[-1.5, -1.0) ┤▇▇▇▇▇▇▇▇▇▇▇▇▇▇▇▇▇▇ 97
|
|
||||||
[-1.0, -0.5) ┤▇▇▇▇▇▇▇▇▇▇▇▇▇▇▇▇▇▇▇▇▇▇▇▇▇▇▇▇ 154
|
|
||||||
[-0.5, 0.0) ┤▇▇▇▇▇▇▇▇▇▇▇▇▇▇▇▇▇▇▇▇▇▇▇▇▇▇▇▇▇▇▇▇▇▇▇ 193
|
|
||||||
[ 0.0, 0.5) ┤▇▇▇▇▇▇▇▇▇▇▇▇▇▇▇▇▇▇▇▇▇▇▇▇▇▇▇▇▇▇ 165
|
|
||||||
[ 0.5, 1.0) ┤▇▇▇▇▇▇▇▇▇▇▇▇▇▇▇▇▇▇▇▇▇▇▇▇▇▇▇▇ 152
|
|
||||||
[ 1.0, 1.5) ┤▇▇▇▇▇▇▇▇▇▇▇▇▇▇▇▇ 86
|
|
||||||
[ 1.5, 2.0) ┤▇▇▇▇▇▇▇▇▇ 51
|
|
||||||
[ 2.0, 2.5) ┤▇▇▇▇ 21
|
|
||||||
[ 2.5, 3.0) ┤▇ 3
|
|
||||||
[ 3.0, 3.5) ┤ 2
|
|
||||||
└ ┘
|
|
||||||
Frequency
|
|
||||||
```
|
|
||||||
|
|
||||||
**scatter**
|
|
||||||
|
|
||||||
```sh
|
|
||||||
wget https://raw.githubusercontent.com/uiuc-cse/data-fa14/gh-pages/data/iris.csv -qO - \
|
|
||||||
| cut -f1-4 -d, \
|
|
||||||
| uplot scatter -H -d, -t IRIS -m 10
|
|
||||||
```
|
|
||||||
|
|
||||||
## Development
|
|
||||||
|
|
||||||
## Contributing
|
## Contributing
|
||||||
|
|
||||||
Bug reports and pull requests are welcome on GitHub at [https://github.com/kojix2/uplot](https://github.com/kojix2/uplot).
|
* [Report bugs](https://github.com/kojix2/youplot/issues)
|
||||||
|
* Fix bugs and [submit pull requests](https://github.com/kojix2/youplot/pulls)
|
||||||
|
* Write, clarify, or fix documentation
|
||||||
|
* Suggest or add new features
|
||||||
|
|
||||||
|
|
||||||
|
### Development
|
||||||
|
|
||||||
|
```sh
|
||||||
|
git clone https://github.com/your_name/GR.rb # Clone the Git repo
|
||||||
|
cd GR.rb
|
||||||
|
bundle install # Install the gem dependencies
|
||||||
|
bundle exec rake test # Run the test
|
||||||
|
bundle exec rake install # Installation from source code
|
||||||
|
```
|
||||||
|
|
||||||
## License
|
## License
|
||||||
|
|
||||||
The gem is available as open source under the terms of the [MIT License](https://opensource.org/licenses/MIT).
|
[MIT License](https://opensource.org/licenses/MIT).
|
||||||
|
|||||||
@@ -1,6 +1,6 @@
|
|||||||
#!/usr/bin/env ruby
|
#!/usr/bin/env ruby
|
||||||
# frozen_string_literal: true
|
# frozen_string_literal: true
|
||||||
|
|
||||||
require 'uplot'
|
require 'youplot'
|
||||||
|
|
||||||
Uplot::Command.new.run
|
YouPlot::Command.new.run
|
||||||
|
|||||||
6
exe/youplot
Executable file
6
exe/youplot
Executable file
@@ -0,0 +1,6 @@
|
|||||||
|
#!/usr/bin/env ruby
|
||||||
|
# frozen_string_literal: true
|
||||||
|
|
||||||
|
require 'youplot'
|
||||||
|
|
||||||
|
YouPlot::Command.new.run
|
||||||
10
lib/uplot.rb
10
lib/uplot.rb
@@ -1,10 +0,0 @@
|
|||||||
# frozen_string_literal: true
|
|
||||||
|
|
||||||
require 'unicode_plot'
|
|
||||||
require 'uplot/version'
|
|
||||||
require 'uplot/preprocessing'
|
|
||||||
require 'uplot/plot'
|
|
||||||
require 'uplot/command'
|
|
||||||
|
|
||||||
module Uplot
|
|
||||||
end
|
|
||||||
@@ -1,69 +0,0 @@
|
|||||||
# frozen_string_literal: true
|
|
||||||
|
|
||||||
require_relative 'preprocessing'
|
|
||||||
require_relative 'command/parser'
|
|
||||||
|
|
||||||
module Uplot
|
|
||||||
Data = Struct.new(:headers, :series)
|
|
||||||
|
|
||||||
class Command
|
|
||||||
attr_accessor :params
|
|
||||||
attr_reader :raw_inputs, :data, :fmt, :parser
|
|
||||||
|
|
||||||
def initialize
|
|
||||||
@params = Params.new
|
|
||||||
|
|
||||||
@raw_inputs = []
|
|
||||||
|
|
||||||
@parser = Parser.new
|
|
||||||
end
|
|
||||||
|
|
||||||
def run
|
|
||||||
parser.parse_options
|
|
||||||
command = parser.command
|
|
||||||
params = parser.params
|
|
||||||
delimiter = parser.delimiter
|
|
||||||
transpose = parser.transpose
|
|
||||||
headers = parser.headers
|
|
||||||
output = parser.output
|
|
||||||
count = parser.count
|
|
||||||
fmt = parser.fmt
|
|
||||||
debug = parser.debug
|
|
||||||
|
|
||||||
if command == :colors
|
|
||||||
Plot.colors
|
|
||||||
exit
|
|
||||||
end
|
|
||||||
|
|
||||||
# Sometimes the input file does not end with a newline code.
|
|
||||||
while input = Kernel.gets(nil)
|
|
||||||
input.freeze
|
|
||||||
@raw_inputs << input
|
|
||||||
@data = Preprocessing.input(input, delimiter, headers, transpose)
|
|
||||||
pp @data if @debug
|
|
||||||
case command
|
|
||||||
when :bar, :barplot
|
|
||||||
Plot.barplot(data, params, @count)
|
|
||||||
when :count, :c
|
|
||||||
Plot.barplot(data, params, count = true)
|
|
||||||
when :hist, :histogram
|
|
||||||
Plot.histogram(data, params)
|
|
||||||
when :line, :lineplot
|
|
||||||
Plot.line(data, params)
|
|
||||||
when :lines, :lineplots
|
|
||||||
Plot.lines(data, params, fmt)
|
|
||||||
when :scatter, :s
|
|
||||||
Plot.scatter(data, params, fmt)
|
|
||||||
when :density, :d
|
|
||||||
Plot.density(data, params, fmt)
|
|
||||||
when :box, :boxplot
|
|
||||||
Plot.boxplot(data, params)
|
|
||||||
else
|
|
||||||
raise "unrecognized plot_type: #{command}"
|
|
||||||
end.render($stderr)
|
|
||||||
|
|
||||||
print input if output
|
|
||||||
end
|
|
||||||
end
|
|
||||||
end
|
|
||||||
end
|
|
||||||
@@ -1,224 +0,0 @@
|
|||||||
# frozen_string_literal: true
|
|
||||||
|
|
||||||
require 'optparse'
|
|
||||||
require_relative 'params'
|
|
||||||
|
|
||||||
module Uplot
|
|
||||||
class Command
|
|
||||||
class Parser
|
|
||||||
attr_reader :command, :params,
|
|
||||||
:delimiter, :transpose, :headers, :output, :count, :fmt, :debug
|
|
||||||
|
|
||||||
def initialize
|
|
||||||
@command = nil
|
|
||||||
@params = Params.new
|
|
||||||
|
|
||||||
@delimiter = "\t"
|
|
||||||
@transpose = false
|
|
||||||
@headers = nil
|
|
||||||
@output = false
|
|
||||||
@count = false
|
|
||||||
@fmt = 'xyy'
|
|
||||||
@debug = false
|
|
||||||
end
|
|
||||||
|
|
||||||
def create_default_parser
|
|
||||||
OptionParser.new do |opt|
|
|
||||||
opt.program_name = 'uplot'
|
|
||||||
opt.version = Uplot::VERSION
|
|
||||||
opt.on('-O', '--output', TrueClass) do |v|
|
|
||||||
@output = v
|
|
||||||
end
|
|
||||||
opt.on('-d', '--delimiter VAL', 'use DELIM instead of TAB for field delimiter', String) do |v|
|
|
||||||
@delimiter = v
|
|
||||||
end
|
|
||||||
opt.on('-H', '--headers', 'specify that the input has header row', TrueClass) do |v|
|
|
||||||
@headers = v
|
|
||||||
end
|
|
||||||
opt.on('-T', '--transpose', TrueClass) do |v|
|
|
||||||
@transpose = v
|
|
||||||
end
|
|
||||||
opt.on('-t', '--title VAL', 'print string on the top of plot', String) do |v|
|
|
||||||
params.title = v
|
|
||||||
end
|
|
||||||
opt.on('-x', '--xlabel VAL', 'print string on the bottom of the plot', String) do |v|
|
|
||||||
params.xlabel = v
|
|
||||||
end
|
|
||||||
opt.on('-y', '--ylabel VAL', 'print string on the far left of the plot', String) do |v|
|
|
||||||
params.ylabel = v
|
|
||||||
end
|
|
||||||
opt.on('-w', '--width VAL', 'number of characters per row', Integer) do |v|
|
|
||||||
params.width = v
|
|
||||||
end
|
|
||||||
opt.on('-h', '--height VAL', 'number of rows', Numeric) do |v|
|
|
||||||
params.height = v
|
|
||||||
end
|
|
||||||
opt.on('-b', '--border VAL', 'specify the style of the bounding box', String) do |v|
|
|
||||||
params.border = v.to_sym
|
|
||||||
end
|
|
||||||
opt.on('-m', '--margin VAL', 'number of spaces to the left of the plot', Numeric) do |v|
|
|
||||||
params.margin = v
|
|
||||||
end
|
|
||||||
opt.on('-p', '--padding VAL', 'space of the left and right of the plot', Numeric) do |v|
|
|
||||||
params.padding = v
|
|
||||||
end
|
|
||||||
opt.on('-c', '--color VAL', 'color of the drawing', String) do |v|
|
|
||||||
params.color = v =~ /\A[0-9]+\z/ ? v.to_i : v.to_sym
|
|
||||||
end
|
|
||||||
opt.on('--[no-]labels', 'hide the labels', TrueClass) do |v|
|
|
||||||
params.labels = v
|
|
||||||
end
|
|
||||||
opt.on('--fmt VAL', 'xyy, xyxy', String) do |v|
|
|
||||||
@fmt = v
|
|
||||||
end
|
|
||||||
opt.on('--debug', TrueClass) do |v|
|
|
||||||
@debug = v
|
|
||||||
end
|
|
||||||
yield opt if block_given?
|
|
||||||
end
|
|
||||||
end
|
|
||||||
|
|
||||||
def main_parser
|
|
||||||
@main_parser ||= create_default_parser do |main_parser|
|
|
||||||
# Usage and help messages
|
|
||||||
main_parser.banner = \
|
|
||||||
<<~MSG
|
|
||||||
Program: uplot (Tools for plotting on the terminal)
|
|
||||||
Version: #{Uplot::VERSION} (using unicode_plot #{UnicodePlot::VERSION})
|
|
||||||
|
|
||||||
Usage: uplot <command> [options]
|
|
||||||
|
|
||||||
Command: barplot bar
|
|
||||||
histogram hist
|
|
||||||
lineplot line
|
|
||||||
scatter s
|
|
||||||
density d
|
|
||||||
boxplot box
|
|
||||||
colors
|
|
||||||
|
|
||||||
Options:
|
|
||||||
MSG
|
|
||||||
end
|
|
||||||
end
|
|
||||||
|
|
||||||
def sub_parser
|
|
||||||
@sub_parser ||= create_default_parser do |parser|
|
|
||||||
parser.banner = <<~MSG
|
|
||||||
Usage: uplot #{command} [options]
|
|
||||||
|
|
||||||
Options:
|
|
||||||
MSG
|
|
||||||
|
|
||||||
case command
|
|
||||||
when nil
|
|
||||||
warn main_parser.help
|
|
||||||
exit 1
|
|
||||||
|
|
||||||
when :barplot, :bar
|
|
||||||
parser.on('--symbol VAL', String) do |v|
|
|
||||||
params.symbol = v
|
|
||||||
end
|
|
||||||
parser.on('--xscale VAL', String) do |v|
|
|
||||||
params.xscale = v
|
|
||||||
end
|
|
||||||
parser.on('--count', TrueClass) do |v|
|
|
||||||
@count = v
|
|
||||||
end
|
|
||||||
|
|
||||||
when :count, :c
|
|
||||||
parser.on('--symbol VAL', String) do |v|
|
|
||||||
params.symbol = v
|
|
||||||
end
|
|
||||||
|
|
||||||
when :histogram, :hist
|
|
||||||
parser.on('-n', '--nbins VAL', Numeric) do |v|
|
|
||||||
params.nbins = v
|
|
||||||
end
|
|
||||||
parser.on('--closed VAL', String) do |v|
|
|
||||||
params.closed = v
|
|
||||||
end
|
|
||||||
parser.on('--symbol VAL', String) do |v|
|
|
||||||
params.symbol = v
|
|
||||||
end
|
|
||||||
|
|
||||||
when :lineplot, :line
|
|
||||||
parser.on('--canvas VAL', String) do |v|
|
|
||||||
params.canvas = v
|
|
||||||
end
|
|
||||||
parser.on('--xlim VAL', Array) do |v|
|
|
||||||
params.xlim = v.take(2)
|
|
||||||
end
|
|
||||||
parser.on('--ylim VAL', Array) do |v|
|
|
||||||
params.ylim = v.take(2)
|
|
||||||
end
|
|
||||||
|
|
||||||
when :lineplots, :lines
|
|
||||||
parser.on('--canvas VAL', String) do |v|
|
|
||||||
params.canvas = v
|
|
||||||
end
|
|
||||||
parser.on('--xlim VAL', Array) do |v|
|
|
||||||
params.xlim = v.take(2)
|
|
||||||
end
|
|
||||||
parser.on('--ylim VAL', Array) do |v|
|
|
||||||
params.ylim = v.take(2)
|
|
||||||
end
|
|
||||||
|
|
||||||
when :scatter, :s
|
|
||||||
parser.on('--canvas VAL', String) do |v|
|
|
||||||
params.canvas = v
|
|
||||||
end
|
|
||||||
parser.on('--xlim VAL', Array) do |v|
|
|
||||||
params.xlim = v.take(2)
|
|
||||||
end
|
|
||||||
parser.on('--ylim VAL', Array) do |v|
|
|
||||||
params.ylim = v.take(2)
|
|
||||||
end
|
|
||||||
|
|
||||||
when :density, :d
|
|
||||||
parser.on('--grid', TrueClass) do |v|
|
|
||||||
params.grid = v
|
|
||||||
end
|
|
||||||
parser.on('--xlim VAL', Array) do |v|
|
|
||||||
params.xlim = v.take(2)
|
|
||||||
end
|
|
||||||
parser.on('--ylim VAL', Array) do |v|
|
|
||||||
params.ylim = v.take(2)
|
|
||||||
end
|
|
||||||
|
|
||||||
when :boxplot, :box
|
|
||||||
parser.on('--xlim VAL', Array) do |v|
|
|
||||||
params.xlim = v.take(2)
|
|
||||||
end
|
|
||||||
|
|
||||||
when :colors
|
|
||||||
parser.on('-n', '--names', TrueClass) do |v|
|
|
||||||
@color_names = v
|
|
||||||
end
|
|
||||||
|
|
||||||
else
|
|
||||||
warn "uplot: unrecognized command '#{command}'"
|
|
||||||
exit 1
|
|
||||||
end
|
|
||||||
end
|
|
||||||
end
|
|
||||||
|
|
||||||
def parse_options(argv = ARGV)
|
|
||||||
begin
|
|
||||||
main_parser.order!(argv)
|
|
||||||
rescue OptionParser::ParseError => e
|
|
||||||
warn "uplot: #{e.message}"
|
|
||||||
exit 1
|
|
||||||
end
|
|
||||||
|
|
||||||
@command = argv.shift&.to_sym
|
|
||||||
|
|
||||||
begin
|
|
||||||
sub_parser.parse!(argv)
|
|
||||||
rescue OptionParser::ParseError => e
|
|
||||||
warn "uplot: #{e.message}"
|
|
||||||
exit 1
|
|
||||||
end
|
|
||||||
end
|
|
||||||
end
|
|
||||||
end
|
|
||||||
end
|
|
||||||
@@ -1,159 +0,0 @@
|
|||||||
# frozen_string_literal: true
|
|
||||||
|
|
||||||
require 'unicode_plot'
|
|
||||||
|
|
||||||
module Uplot
|
|
||||||
# plotting functions.
|
|
||||||
module Plot
|
|
||||||
module_function
|
|
||||||
|
|
||||||
def barplot(data, params, count = false)
|
|
||||||
headers = data.headers
|
|
||||||
series = data.series
|
|
||||||
if count
|
|
||||||
series = Preprocessing.count(series[0])
|
|
||||||
params.title = headers[0] if headers
|
|
||||||
end
|
|
||||||
params.title ||= headers[1] if headers
|
|
||||||
labels = series[0]
|
|
||||||
values = series[1].map(&:to_f)
|
|
||||||
UnicodePlot.barplot(labels, values, **params.to_hc)
|
|
||||||
end
|
|
||||||
|
|
||||||
def histogram(data, params)
|
|
||||||
headers = data.headers
|
|
||||||
series = data.series
|
|
||||||
params.title ||= data.headers[0] if headers
|
|
||||||
values = series[0].map(&:to_f)
|
|
||||||
UnicodePlot.histogram(values, **params.to_hc)
|
|
||||||
end
|
|
||||||
|
|
||||||
def line(data, params)
|
|
||||||
headers = data.headers
|
|
||||||
series = data.series
|
|
||||||
if series.size == 1
|
|
||||||
# If there is only one series, it is assumed to be sequential data.
|
|
||||||
params.ylabel ||= headers[0] if headers
|
|
||||||
y = series[0].map(&:to_f)
|
|
||||||
UnicodePlot.lineplot(y, **params.to_hc)
|
|
||||||
else
|
|
||||||
# If there are 2 or more series,
|
|
||||||
# assume that the first 2 series are the x and y series respectively.
|
|
||||||
if headers
|
|
||||||
params.xlabel ||= headers[0]
|
|
||||||
params.ylabel ||= headers[1]
|
|
||||||
end
|
|
||||||
x = series[0].map(&:to_f)
|
|
||||||
y = series[1].map(&:to_f)
|
|
||||||
UnicodePlot.lineplot(x, y, **params.to_hc)
|
|
||||||
end
|
|
||||||
end
|
|
||||||
|
|
||||||
def get_method2(method1)
|
|
||||||
(method1.to_s + '!').to_sym
|
|
||||||
end
|
|
||||||
|
|
||||||
def xyy_plot(data, method1, params)
|
|
||||||
headers = data.headers
|
|
||||||
series = data.series
|
|
||||||
method2 = get_method2(method1)
|
|
||||||
series.map! { |s| s.map(&:to_f) }
|
|
||||||
if headers
|
|
||||||
params.name ||= headers[1]
|
|
||||||
params.xlabel ||= headers[0]
|
|
||||||
end
|
|
||||||
params.ylim ||= series[1..-1].flatten.minmax # why need?
|
|
||||||
plot = UnicodePlot.public_send(method1, series[0], series[1], **params.to_hc)
|
|
||||||
2.upto(series.size - 1) do |i|
|
|
||||||
UnicodePlot.public_send(method2, plot, series[0], series[i], name: headers&.[](i))
|
|
||||||
end
|
|
||||||
plot
|
|
||||||
end
|
|
||||||
|
|
||||||
def xyxy_plot(data, method1, params)
|
|
||||||
headers = data.headers
|
|
||||||
series = data.series
|
|
||||||
method2 = get_method2(method1)
|
|
||||||
series.map! { |s| s.map(&:to_f) }
|
|
||||||
series = series.each_slice(2).to_a
|
|
||||||
params.name ||= headers[0] if headers
|
|
||||||
params.xlim = series.map(&:first).flatten.minmax # why need?
|
|
||||||
params.ylim = series.map(&:last).flatten.minmax # why need?
|
|
||||||
x1, y1 = series.shift
|
|
||||||
plot = UnicodePlot.public_send(method1, x1, y1, **params.to_hc)
|
|
||||||
series.each_with_index do |(xi, yi), i|
|
|
||||||
UnicodePlot.public_send(method2, plot, xi, yi, name: headers&.[]((i + 1) * 2))
|
|
||||||
end
|
|
||||||
plot
|
|
||||||
end
|
|
||||||
|
|
||||||
def lines(data, params, fmt = 'xyy')
|
|
||||||
check_series_size(data, fmt)
|
|
||||||
case fmt
|
|
||||||
when 'xyy'
|
|
||||||
xyy_plot(data, :lineplot, params)
|
|
||||||
when 'xyxy'
|
|
||||||
xyxy_plot(data, :lineplot, params)
|
|
||||||
end
|
|
||||||
end
|
|
||||||
|
|
||||||
def scatter(data, params, fmt = 'xyy')
|
|
||||||
check_series_size(data, fmt)
|
|
||||||
case fmt
|
|
||||||
when 'xyy'
|
|
||||||
xyy_plot(data, :scatterplot, params)
|
|
||||||
when 'xyxy'
|
|
||||||
xyxy_plot(data, :scatterplot, params)
|
|
||||||
end
|
|
||||||
end
|
|
||||||
|
|
||||||
def density(data, params, fmt = 'xyy')
|
|
||||||
check_series_size(data, fmt)
|
|
||||||
case fmt
|
|
||||||
when 'xyy'
|
|
||||||
xyy_plot(data, :densityplot, params)
|
|
||||||
when 'xyxy'
|
|
||||||
xyxy_plot(data, :densityplot, params)
|
|
||||||
end
|
|
||||||
end
|
|
||||||
|
|
||||||
def boxplot(data, params)
|
|
||||||
headers = data.headers
|
|
||||||
series = data.series
|
|
||||||
headers ||= (1..series.size).map(&:to_s)
|
|
||||||
series.map! { |s| s.map(&:to_f) }
|
|
||||||
UnicodePlot.boxplot(headers, series, **params.to_hc)
|
|
||||||
end
|
|
||||||
|
|
||||||
def colors
|
|
||||||
UnicodePlot::StyledPrinter::TEXT_COLORS.each do |k, v|
|
|
||||||
print v
|
|
||||||
print k
|
|
||||||
print "\t"
|
|
||||||
print ' ●'
|
|
||||||
print "\033[0m"
|
|
||||||
print "\t"
|
|
||||||
end
|
|
||||||
puts
|
|
||||||
end
|
|
||||||
|
|
||||||
def check_series_size(data, fmt)
|
|
||||||
series = data.series
|
|
||||||
if series.size == 1
|
|
||||||
warn 'uplot: There is only one series of input data. Please check the delimiter.'
|
|
||||||
warn ''
|
|
||||||
warn " Headers: \e[35m#{data.headers.inspect}\e[0m"
|
|
||||||
warn " The first item is: \e[35m\"#{series[0][0]}\"\e[0m"
|
|
||||||
warn " The last item is : \e[35m\"#{series[0][-1]}\"\e[0m"
|
|
||||||
exit 1
|
|
||||||
end
|
|
||||||
if fmt == 'xyxy' && series.size.odd?
|
|
||||||
warn 'uplot: In the xyxy format, the number of series must be even.'
|
|
||||||
warn ''
|
|
||||||
warn " Number of series: \e[35m#{series.size}\e[0m"
|
|
||||||
warn " Headers: \e[35m#{data.headers.inspect}\e[0m"
|
|
||||||
exit 1
|
|
||||||
end
|
|
||||||
end
|
|
||||||
end
|
|
||||||
end
|
|
||||||
9
lib/youplot.rb
Normal file
9
lib/youplot.rb
Normal file
@@ -0,0 +1,9 @@
|
|||||||
|
# frozen_string_literal: true
|
||||||
|
|
||||||
|
require 'unicode_plot'
|
||||||
|
require 'youplot/version'
|
||||||
|
require 'youplot/dsv_reader'
|
||||||
|
require 'youplot/command'
|
||||||
|
|
||||||
|
module YouPlot
|
||||||
|
end
|
||||||
24
lib/youplot/backends/processing.rb
Normal file
24
lib/youplot/backends/processing.rb
Normal file
@@ -0,0 +1,24 @@
|
|||||||
|
# frozen_string_literal: true
|
||||||
|
|
||||||
|
module YouPlot
|
||||||
|
# plotting functions.
|
||||||
|
module Backends
|
||||||
|
module Processing
|
||||||
|
module_function
|
||||||
|
|
||||||
|
def count_values(arr)
|
||||||
|
# tally was added in Ruby 2.7
|
||||||
|
if Enumerable.method_defined? :tally
|
||||||
|
arr.tally
|
||||||
|
else
|
||||||
|
# https://github.com/marcandre/backports
|
||||||
|
arr.each_with_object(Hash.new(0)) { |item, res| res[item] += 1 }
|
||||||
|
.tap { |h| h.default = nil }
|
||||||
|
end
|
||||||
|
.sort { |a, b| a[1] <=> b[1] }
|
||||||
|
.reverse
|
||||||
|
.transpose
|
||||||
|
end
|
||||||
|
end
|
||||||
|
end
|
||||||
|
end
|
||||||
194
lib/youplot/backends/unicode_plot_backend.rb
Normal file
194
lib/youplot/backends/unicode_plot_backend.rb
Normal file
@@ -0,0 +1,194 @@
|
|||||||
|
# frozen_string_literal: true
|
||||||
|
|
||||||
|
require_relative 'processing'
|
||||||
|
require 'unicode_plot'
|
||||||
|
|
||||||
|
module YouPlot
|
||||||
|
# plotting functions.
|
||||||
|
module Backends
|
||||||
|
module UnicodePlotBackend
|
||||||
|
module_function
|
||||||
|
|
||||||
|
def barplot(data, params, fmt = nil, count: false)
|
||||||
|
headers = data.headers
|
||||||
|
series = data.series
|
||||||
|
# `uplot count`
|
||||||
|
if count
|
||||||
|
series = Processing.count_values(series[0])
|
||||||
|
params.title = headers[0] if headers
|
||||||
|
end
|
||||||
|
if series.size == 1
|
||||||
|
# If there is only one series.use the line number for label.
|
||||||
|
params.title ||= headers[0] if headers
|
||||||
|
labels = Array.new(series[0].size) { |i| (i + 1).to_s }
|
||||||
|
values = series[0].map(&:to_f)
|
||||||
|
else
|
||||||
|
# If there are 2 or more series...
|
||||||
|
if fmt == 'yx'
|
||||||
|
# assume that the first 2 series are the y and x series respectively.
|
||||||
|
x_col = 1
|
||||||
|
y_col = 0
|
||||||
|
else
|
||||||
|
# assume that the first 2 series are the x and y series respectively.
|
||||||
|
x_col = 0
|
||||||
|
y_col = 1
|
||||||
|
end
|
||||||
|
params.title ||= headers[y_col] if headers
|
||||||
|
labels = series[x_col]
|
||||||
|
values = series[y_col].map(&:to_f)
|
||||||
|
end
|
||||||
|
UnicodePlot.barplot(labels, values, **params.to_hc)
|
||||||
|
end
|
||||||
|
|
||||||
|
def histogram(data, params)
|
||||||
|
headers = data.headers
|
||||||
|
series = data.series
|
||||||
|
params.title ||= data.headers[0] if headers
|
||||||
|
values = series[0].map(&:to_f)
|
||||||
|
UnicodePlot.histogram(values, **params.to_hc)
|
||||||
|
end
|
||||||
|
|
||||||
|
def line(data, params, fmt = nil)
|
||||||
|
headers = data.headers
|
||||||
|
series = data.series
|
||||||
|
if series.size == 1
|
||||||
|
# If there is only one series, it is assumed to be sequential data.
|
||||||
|
params.ylabel ||= headers[0] if headers
|
||||||
|
y = series[0].map(&:to_f)
|
||||||
|
UnicodePlot.lineplot(y, **params.to_hc)
|
||||||
|
else
|
||||||
|
# If there are 2 or more series...
|
||||||
|
if fmt == 'yx'
|
||||||
|
# assume that the first 2 series are the y and x series respectively.
|
||||||
|
x_col = 1
|
||||||
|
y_col = 0
|
||||||
|
else
|
||||||
|
# assume that the first 2 series are the x and y series respectively.
|
||||||
|
x_col = 0
|
||||||
|
y_col = 1
|
||||||
|
end
|
||||||
|
if headers
|
||||||
|
params.xlabel ||= headers[x_col]
|
||||||
|
params.ylabel ||= headers[y_col]
|
||||||
|
end
|
||||||
|
x = series[x_col].map(&:to_f)
|
||||||
|
y = series[y_col].map(&:to_f)
|
||||||
|
UnicodePlot.lineplot(x, y, **params.to_hc)
|
||||||
|
end
|
||||||
|
end
|
||||||
|
|
||||||
|
def get_method2(method1)
|
||||||
|
"#{method1}!".to_sym
|
||||||
|
end
|
||||||
|
|
||||||
|
def plot_xyy(data, method1, params)
|
||||||
|
headers = data.headers
|
||||||
|
series = data.series
|
||||||
|
method2 = get_method2(method1)
|
||||||
|
series.map! { |s| s.map(&:to_f) }
|
||||||
|
if headers
|
||||||
|
params.name ||= headers[1]
|
||||||
|
params.xlabel ||= headers[0]
|
||||||
|
end
|
||||||
|
params.ylim ||= series[1..-1].flatten.minmax # why need?
|
||||||
|
plot = UnicodePlot.public_send(method1, series[0], series[1], **params.to_hc)
|
||||||
|
2.upto(series.size - 1) do |i|
|
||||||
|
UnicodePlot.public_send(method2, plot, series[0], series[i], name: headers&.[](i))
|
||||||
|
end
|
||||||
|
plot
|
||||||
|
end
|
||||||
|
|
||||||
|
def plot_xyxy(data, method1, params)
|
||||||
|
headers = data.headers
|
||||||
|
series = data.series
|
||||||
|
method2 = get_method2(method1)
|
||||||
|
series.map! { |s| s.map(&:to_f) }
|
||||||
|
series = series.each_slice(2).to_a
|
||||||
|
params.name ||= headers[0] if headers
|
||||||
|
params.xlim = series.map(&:first).flatten.minmax # why need?
|
||||||
|
params.ylim = series.map(&:last).flatten.minmax # why need?
|
||||||
|
x1, y1 = series.shift
|
||||||
|
plot = UnicodePlot.public_send(method1, x1, y1, **params.to_hc)
|
||||||
|
series.each_with_index do |(xi, yi), i|
|
||||||
|
UnicodePlot.public_send(method2, plot, xi, yi, name: headers&.[]((i + 1) * 2))
|
||||||
|
end
|
||||||
|
plot
|
||||||
|
end
|
||||||
|
|
||||||
|
def plot_fmt(data, fmt, method1, params)
|
||||||
|
case fmt
|
||||||
|
when 'xyy'
|
||||||
|
plot_xyy(data, method1, params)
|
||||||
|
when 'xyxy'
|
||||||
|
plot_xyxy(data, method1, params)
|
||||||
|
when 'yx'
|
||||||
|
raise "Incorrect format: #{fmt}"
|
||||||
|
else
|
||||||
|
raise "Unknown format: #{fmt}"
|
||||||
|
end
|
||||||
|
end
|
||||||
|
|
||||||
|
def lines(data, params, fmt = 'xyy')
|
||||||
|
check_series_size(data, fmt)
|
||||||
|
plot_fmt(data, fmt, :lineplot, params)
|
||||||
|
end
|
||||||
|
|
||||||
|
def scatter(data, params, fmt = 'xyy')
|
||||||
|
check_series_size(data, fmt)
|
||||||
|
plot_fmt(data, fmt, :scatterplot, params)
|
||||||
|
end
|
||||||
|
|
||||||
|
def density(data, params, fmt = 'xyy')
|
||||||
|
check_series_size(data, fmt)
|
||||||
|
plot_fmt(data, fmt, :densityplot, params)
|
||||||
|
end
|
||||||
|
|
||||||
|
def boxplot(data, params)
|
||||||
|
headers = data.headers
|
||||||
|
series = data.series
|
||||||
|
headers ||= (1..series.size).map(&:to_s)
|
||||||
|
series.map! { |s| s.map(&:to_f) }
|
||||||
|
UnicodePlot.boxplot(headers, series, **params.to_hc)
|
||||||
|
end
|
||||||
|
|
||||||
|
def colors(color_names = false)
|
||||||
|
# FIXME
|
||||||
|
s = String.new
|
||||||
|
UnicodePlot::StyledPrinter::TEXT_COLORS.each do |k, v|
|
||||||
|
s << v
|
||||||
|
s << k.to_s
|
||||||
|
unless color_names
|
||||||
|
s << "\t"
|
||||||
|
s << ' ●'
|
||||||
|
end
|
||||||
|
s << "\033[0m"
|
||||||
|
s << "\t"
|
||||||
|
end
|
||||||
|
s << "\n"
|
||||||
|
def s.render(obj)
|
||||||
|
obj.print(self)
|
||||||
|
end
|
||||||
|
s
|
||||||
|
end
|
||||||
|
|
||||||
|
def check_series_size(data, fmt)
|
||||||
|
series = data.series
|
||||||
|
if series.size == 1
|
||||||
|
warn 'youplot: There is only one series of input data. Please check the delimiter.'
|
||||||
|
warn ''
|
||||||
|
warn " Headers: \e[35m#{data.headers.inspect}\e[0m"
|
||||||
|
warn " The first item is: \e[35m\"#{series[0][0]}\"\e[0m"
|
||||||
|
warn " The last item is : \e[35m\"#{series[0][-1]}\"\e[0m"
|
||||||
|
exit 1
|
||||||
|
end
|
||||||
|
if fmt == 'xyxy' && series.size.odd?
|
||||||
|
warn 'YouPlot: In the xyxy format, the number of series must be even.'
|
||||||
|
warn ''
|
||||||
|
warn " Number of series: \e[35m#{series.size}\e[0m"
|
||||||
|
warn " Headers: \e[35m#{data.headers.inspect}\e[0m"
|
||||||
|
exit 1
|
||||||
|
end
|
||||||
|
end
|
||||||
|
end
|
||||||
|
end
|
||||||
|
end
|
||||||
110
lib/youplot/command.rb
Normal file
110
lib/youplot/command.rb
Normal file
@@ -0,0 +1,110 @@
|
|||||||
|
# frozen_string_literal: true
|
||||||
|
|
||||||
|
require_relative 'dsv_reader'
|
||||||
|
require_relative 'command/parser'
|
||||||
|
|
||||||
|
# FIXME
|
||||||
|
require_relative 'backends/unicode_plot_backend'
|
||||||
|
|
||||||
|
module YouPlot
|
||||||
|
Data = Struct.new(:headers, :series)
|
||||||
|
|
||||||
|
class Command
|
||||||
|
attr_accessor :command, :params, :options
|
||||||
|
attr_reader :data, :parser
|
||||||
|
|
||||||
|
def initialize(argv = ARGV)
|
||||||
|
@argv = argv
|
||||||
|
@parser = Parser.new
|
||||||
|
@command = nil
|
||||||
|
@params = nil
|
||||||
|
@options = nil
|
||||||
|
@backend = YouPlot::Backends::UnicodePlotBackend
|
||||||
|
end
|
||||||
|
|
||||||
|
def run
|
||||||
|
parser.parse_options(@argv)
|
||||||
|
@command ||= parser.command
|
||||||
|
@options ||= parser.options
|
||||||
|
@params ||= parser.params
|
||||||
|
|
||||||
|
if %i[colors color colours colour].include? @command
|
||||||
|
plot = create_plot
|
||||||
|
output_plot(plot)
|
||||||
|
else
|
||||||
|
# Sometimes the input file does not end with a newline code.
|
||||||
|
while (input = Kernel.gets(nil))
|
||||||
|
main(input)
|
||||||
|
end
|
||||||
|
end
|
||||||
|
end
|
||||||
|
|
||||||
|
private
|
||||||
|
|
||||||
|
def main(input)
|
||||||
|
output_data(input)
|
||||||
|
|
||||||
|
@data = read_dsv(input)
|
||||||
|
|
||||||
|
pp @data if options[:debug]
|
||||||
|
|
||||||
|
plot = create_plot
|
||||||
|
output_plot(plot)
|
||||||
|
end
|
||||||
|
|
||||||
|
def read_dsv(input)
|
||||||
|
input = input.dup.force_encoding(options[:encoding]).encode('utf-8') if options[:encoding]
|
||||||
|
DSVReader.input(input, options[:delimiter], options[:headers], options[:transpose])
|
||||||
|
end
|
||||||
|
|
||||||
|
def create_plot
|
||||||
|
case command
|
||||||
|
when :bar, :barplot
|
||||||
|
@backend.barplot(data, params, options[:fmt])
|
||||||
|
when :count, :c
|
||||||
|
@backend.barplot(data, params, count: true)
|
||||||
|
when :hist, :histogram
|
||||||
|
@backend.histogram(data, params)
|
||||||
|
when :line, :lineplot
|
||||||
|
@backend.line(data, params, options[:fmt])
|
||||||
|
when :lines, :lineplots
|
||||||
|
@backend.lines(data, params, options[:fmt])
|
||||||
|
when :scatter, :s
|
||||||
|
@backend.scatter(data, params, options[:fmt])
|
||||||
|
when :density, :d
|
||||||
|
@backend.density(data, params, options[:fmt])
|
||||||
|
when :box, :boxplot
|
||||||
|
@backend.boxplot(data, params)
|
||||||
|
when :colors, :color, :colours, :colour
|
||||||
|
@backend.colors(options[:color_names])
|
||||||
|
else
|
||||||
|
raise "unrecognized plot_type: #{command}"
|
||||||
|
end
|
||||||
|
end
|
||||||
|
|
||||||
|
def output_data(input)
|
||||||
|
# Pass the input to subsequent pipelines
|
||||||
|
case options[:pass]
|
||||||
|
when IO
|
||||||
|
options[:pass].print(input)
|
||||||
|
else
|
||||||
|
if options[:pass]
|
||||||
|
File.open(options[:pass], 'w') do |f|
|
||||||
|
f.print(input)
|
||||||
|
end
|
||||||
|
end
|
||||||
|
end
|
||||||
|
end
|
||||||
|
|
||||||
|
def output_plot(plot)
|
||||||
|
case options[:output]
|
||||||
|
when IO
|
||||||
|
plot.render(options[:output])
|
||||||
|
else
|
||||||
|
File.open(options[:output], 'w') do |f|
|
||||||
|
plot.render(f)
|
||||||
|
end
|
||||||
|
end
|
||||||
|
end
|
||||||
|
end
|
||||||
|
end
|
||||||
18
lib/youplot/command/cmd_options.rb
Normal file
18
lib/youplot/command/cmd_options.rb
Normal file
@@ -0,0 +1,18 @@
|
|||||||
|
# frozen_string_literal: true
|
||||||
|
|
||||||
|
module YouPlot
|
||||||
|
class Command
|
||||||
|
CmdOptions = Struct.new(
|
||||||
|
:delimiter,
|
||||||
|
:transpose,
|
||||||
|
:headers,
|
||||||
|
:pass,
|
||||||
|
:output,
|
||||||
|
:fmt,
|
||||||
|
:encoding,
|
||||||
|
:color_names,
|
||||||
|
:debug,
|
||||||
|
keyword_init: true
|
||||||
|
)
|
||||||
|
end
|
||||||
|
end
|
||||||
286
lib/youplot/command/parser.rb
Normal file
286
lib/youplot/command/parser.rb
Normal file
@@ -0,0 +1,286 @@
|
|||||||
|
# frozen_string_literal: true
|
||||||
|
|
||||||
|
require 'optparse'
|
||||||
|
require_relative 'cmd_options'
|
||||||
|
require_relative 'plot_params'
|
||||||
|
|
||||||
|
module YouPlot
|
||||||
|
class Command
|
||||||
|
class Parser
|
||||||
|
attr_reader :command, :options, :params
|
||||||
|
|
||||||
|
def initialize
|
||||||
|
@command = nil
|
||||||
|
|
||||||
|
@options = CmdOptions.new(
|
||||||
|
delimiter: "\t",
|
||||||
|
transpose: false,
|
||||||
|
headers: nil,
|
||||||
|
pass: false,
|
||||||
|
output: $stderr,
|
||||||
|
fmt: 'xyy',
|
||||||
|
encoding: nil,
|
||||||
|
color_names: false,
|
||||||
|
debug: false
|
||||||
|
)
|
||||||
|
|
||||||
|
@params = PlotParams.new
|
||||||
|
end
|
||||||
|
|
||||||
|
def create_default_parser
|
||||||
|
OptionParser.new do |opt|
|
||||||
|
opt.program_name = 'YouPlot'
|
||||||
|
opt.version = YouPlot::VERSION
|
||||||
|
opt.summary_width = 24
|
||||||
|
opt.on_tail('') # Add a blank line at the end
|
||||||
|
opt.separator('')
|
||||||
|
opt.on('Common options:')
|
||||||
|
opt.on('-O', '--pass [FILE]', 'file to output input data to [stdout]',
|
||||||
|
'for inserting YouPlot in the middle of Unix pipes') do |v|
|
||||||
|
@options[:pass] = v || $stdout
|
||||||
|
end
|
||||||
|
opt.on('-o', '--output [FILE]', 'file to output plots to [stdout]',
|
||||||
|
'If no option is specified, plot will print to stderr') do |v|
|
||||||
|
@options[:output] = v || $stdout
|
||||||
|
end
|
||||||
|
opt.on('-d', '--delimiter VAL', String, 'use DELIM instead of TAB for field delimiter') do |v|
|
||||||
|
@options[:delimiter] = v
|
||||||
|
end
|
||||||
|
opt.on('-H', '--headers', TrueClass, 'specify that the input has header row') do |v|
|
||||||
|
@options[:headers] = v
|
||||||
|
end
|
||||||
|
opt.on('-T', '--transpose', TrueClass, 'transpose the axes of the input data') do |v|
|
||||||
|
@options[:transpose] = v
|
||||||
|
end
|
||||||
|
opt.on('-t', '--title VAL', String, 'print string on the top of plot') do |v|
|
||||||
|
params.title = v
|
||||||
|
end
|
||||||
|
opt.on('-x', '--xlabel VAL', String, 'print string on the bottom of the plot') do |v|
|
||||||
|
params.xlabel = v
|
||||||
|
end
|
||||||
|
opt.on('-y', '--ylabel VAL', String, 'print string on the far left of the plot') do |v|
|
||||||
|
params.ylabel = v
|
||||||
|
end
|
||||||
|
opt.on('-w', '--width VAL', Integer, 'number of characters per row') do |v|
|
||||||
|
params.width = v
|
||||||
|
end
|
||||||
|
opt.on('-h', '--height VAL', Numeric, 'number of rows') do |v|
|
||||||
|
params.height = v
|
||||||
|
end
|
||||||
|
opt.on('-b', '--border VAL', String, 'specify the style of the bounding box') do |v|
|
||||||
|
params.border = v.to_sym
|
||||||
|
end
|
||||||
|
opt.on('-m', '--margin VAL', Numeric, 'number of spaces to the left of the plot') do |v|
|
||||||
|
params.margin = v
|
||||||
|
end
|
||||||
|
opt.on('-p', '--padding VAL', Numeric, 'space of the left and right of the plot') do |v|
|
||||||
|
params.padding = v
|
||||||
|
end
|
||||||
|
opt.on('-c', '--color VAL', String, 'color of the drawing') do |v|
|
||||||
|
params.color = v =~ /\A[0-9]+\z/ ? v.to_i : v.to_sym
|
||||||
|
end
|
||||||
|
opt.on('--[no-]labels', TrueClass, 'hide the labels') do |v|
|
||||||
|
params.labels = v
|
||||||
|
end
|
||||||
|
opt.on('--progress', TrueClass, 'progressive') do |v|
|
||||||
|
@options[:progressive] = v
|
||||||
|
end
|
||||||
|
opt.on('--encoding VAL', String, 'Specify the input encoding') do |v|
|
||||||
|
@options[:encoding] = v
|
||||||
|
end
|
||||||
|
# Optparse adds the help option, but it doesn't show up in usage.
|
||||||
|
# This is why you need the code below.
|
||||||
|
opt.on('--help', 'print sub-command help menu') do
|
||||||
|
puts opt.help
|
||||||
|
exit
|
||||||
|
end
|
||||||
|
opt.on('--debug', TrueClass, 'print preprocessed data') do |v|
|
||||||
|
@options[:debug] = v
|
||||||
|
end
|
||||||
|
yield opt if block_given?
|
||||||
|
end
|
||||||
|
end
|
||||||
|
|
||||||
|
def main_parser
|
||||||
|
@main_parser ||= create_default_parser do |main_parser|
|
||||||
|
# Here, help message is stored in the banner.
|
||||||
|
# Because help of main_parser may be referred by `sub_parser`.
|
||||||
|
|
||||||
|
main_parser.banner = \
|
||||||
|
<<~MSG
|
||||||
|
|
||||||
|
Program: YouPlot (Tools for plotting on the terminal)
|
||||||
|
Version: #{YouPlot::VERSION} (using UnicodePlot #{UnicodePlot::VERSION})
|
||||||
|
Source: https://github.com/kojix2/youplot
|
||||||
|
|
||||||
|
Usage: uplot <command> [options] <in.tsv>
|
||||||
|
|
||||||
|
Commands:
|
||||||
|
barplot bar draw a horizontal barplot
|
||||||
|
histogram hist draw a horizontal histogram
|
||||||
|
lineplot line draw a line chart
|
||||||
|
lineplots lines draw a line chart with multiple series
|
||||||
|
scatter s draw a scatter plot
|
||||||
|
density d draw a density plot
|
||||||
|
boxplot box draw a horizontal boxplot
|
||||||
|
colors color show the list of available colors
|
||||||
|
|
||||||
|
count c draw a baplot based on the number of
|
||||||
|
occurrences (slow)
|
||||||
|
|
||||||
|
General options:
|
||||||
|
--help print command specific help menu
|
||||||
|
--version print the version of YouPlot
|
||||||
|
MSG
|
||||||
|
|
||||||
|
# Actually, main_parser can take common optional arguments.
|
||||||
|
# However, these options dose not be shown in the help menu.
|
||||||
|
# I think the main help should be simple.
|
||||||
|
main_parser.on('--help', 'print sub-command help menu') do
|
||||||
|
puts main_parser.banner
|
||||||
|
puts
|
||||||
|
exit
|
||||||
|
end
|
||||||
|
end
|
||||||
|
end
|
||||||
|
|
||||||
|
def sub_parser
|
||||||
|
@sub_parser ||= create_default_parser do |parser|
|
||||||
|
parser.banner = <<~MSG
|
||||||
|
|
||||||
|
Usage: YouPlot #{command} [options] <in.tsv>
|
||||||
|
|
||||||
|
Options for #{command}:
|
||||||
|
MSG
|
||||||
|
|
||||||
|
case command
|
||||||
|
|
||||||
|
# If you type only `uplot` in the terminal.
|
||||||
|
when nil
|
||||||
|
warn main_parser.banner
|
||||||
|
warn "\n"
|
||||||
|
exit 1
|
||||||
|
|
||||||
|
when :barplot, :bar
|
||||||
|
parser.on_head('--symbol VAL', String, 'character to be used to plot the bars') do |v|
|
||||||
|
params.symbol = v
|
||||||
|
end
|
||||||
|
parser.on_head('--xscale VAL', String, 'axis scaling') do |v|
|
||||||
|
params.xscale = v
|
||||||
|
end
|
||||||
|
parser.on_head('--fmt VAL', String, 'xy : header is like x, y...', 'yx : header is like y, x...') do |v|
|
||||||
|
@options[:fmt] = v
|
||||||
|
end
|
||||||
|
|
||||||
|
when :count, :c
|
||||||
|
parser.on_head('--symbol VAL', String, 'character to be used to plot the bars') do |v|
|
||||||
|
params.symbol = v
|
||||||
|
end
|
||||||
|
|
||||||
|
when :histogram, :hist
|
||||||
|
parser.on_head('-n', '--nbins VAL', Numeric, 'approximate number of bins') do |v|
|
||||||
|
params.nbins = v
|
||||||
|
end
|
||||||
|
parser.on_head('--closed VAL', String) do |v|
|
||||||
|
params.closed = v
|
||||||
|
end
|
||||||
|
parser.on_head('--symbol VAL', String, 'character to be used to plot the bars') do |v|
|
||||||
|
params.symbol = v
|
||||||
|
end
|
||||||
|
|
||||||
|
when :lineplot, :line
|
||||||
|
parser.on_head('--canvas VAL', String, 'type of canvas') do |v|
|
||||||
|
params.canvas = v
|
||||||
|
end
|
||||||
|
parser.on_head('--xlim VAL', Array, 'plotting range for the x coordinate') do |v|
|
||||||
|
params.xlim = v.take(2)
|
||||||
|
end
|
||||||
|
parser.on_head('--ylim VAL', Array, 'plotting range for the y coordinate') do |v|
|
||||||
|
params.ylim = v.take(2)
|
||||||
|
end
|
||||||
|
parser.on_head('--fmt VAL', String, 'xy : header is like x, y...', 'yx : header is like y, x...') do |v|
|
||||||
|
@options[:fmt] = v
|
||||||
|
end
|
||||||
|
|
||||||
|
when :lineplots, :lines
|
||||||
|
parser.on_head('--canvas VAL', String) do |v|
|
||||||
|
params.canvas = v
|
||||||
|
end
|
||||||
|
parser.on_head('--xlim VAL', Array, 'plotting range for the x coordinate') do |v|
|
||||||
|
params.xlim = v.take(2)
|
||||||
|
end
|
||||||
|
parser.on_head('--ylim VAL', Array, 'plotting range for the y coordinate') do |v|
|
||||||
|
params.ylim = v.take(2)
|
||||||
|
end
|
||||||
|
parser.on_head('--fmt VAL', String, 'xyxy : header is like x1, y1, x2, y2, x3, y3...',
|
||||||
|
'xyy : header is like x, y1, y2, y2, y3...') do |v|
|
||||||
|
@options[:fmt] = v
|
||||||
|
end
|
||||||
|
|
||||||
|
when :scatter, :s
|
||||||
|
parser.on_head('--canvas VAL', String) do |v|
|
||||||
|
params.canvas = v
|
||||||
|
end
|
||||||
|
parser.on_head('--xlim VAL', Array, 'plotting range for the x coordinate') do |v|
|
||||||
|
params.xlim = v.take(2)
|
||||||
|
end
|
||||||
|
parser.on_head('--ylim VAL', Array, 'plotting range for the y coordinate') do |v|
|
||||||
|
params.ylim = v.take(2)
|
||||||
|
end
|
||||||
|
parser.on_head('--fmt VAL', String, 'xyxy : header is like x1, y1, x2, y2, x3, y3...',
|
||||||
|
'xyy : header is like x, y1, y2, y2, y3...') do |v|
|
||||||
|
@options[:fmt] = v
|
||||||
|
end
|
||||||
|
|
||||||
|
when :density, :d
|
||||||
|
parser.on_head('--grid', TrueClass) do |v|
|
||||||
|
params.grid = v
|
||||||
|
end
|
||||||
|
parser.on_head('--xlim VAL', Array, 'plotting range for the x coordinate') do |v|
|
||||||
|
params.xlim = v.take(2)
|
||||||
|
end
|
||||||
|
parser.on_head('--ylim VAL', Array, 'plotting range for the y coordinate') do |v|
|
||||||
|
params.ylim = v.take(2)
|
||||||
|
end
|
||||||
|
parser.on('--fmt VAL', String, 'xyxy : header is like x1, y1, x2, y2, x3, y3...',
|
||||||
|
'xyy : header is like x, y1, y2, y2, y3...') do |v|
|
||||||
|
@options[:fmt] = v
|
||||||
|
end
|
||||||
|
|
||||||
|
when :boxplot, :box
|
||||||
|
parser.on_head('--xlim VAL', Array, 'plotting range for the x coordinate') do |v|
|
||||||
|
params.xlim = v.take(2)
|
||||||
|
end
|
||||||
|
|
||||||
|
when :colors, :color, :colours, :colour
|
||||||
|
parser.on_head('-n', '--names', 'show color names only', TrueClass) do |v|
|
||||||
|
@options[:color_names] = v
|
||||||
|
end
|
||||||
|
|
||||||
|
else
|
||||||
|
warn "uplot: unrecognized command '#{command}'"
|
||||||
|
exit 1
|
||||||
|
end
|
||||||
|
end
|
||||||
|
end
|
||||||
|
|
||||||
|
def parse_options(argv = ARGV)
|
||||||
|
begin
|
||||||
|
main_parser.order!(argv)
|
||||||
|
rescue OptionParser::ParseError => e
|
||||||
|
warn "uplot: #{e.message}"
|
||||||
|
exit 1
|
||||||
|
end
|
||||||
|
|
||||||
|
@command = argv.shift&.to_sym
|
||||||
|
|
||||||
|
begin
|
||||||
|
sub_parser.parse!(argv)
|
||||||
|
rescue OptionParser::ParseError => e
|
||||||
|
warn "uplot: #{e.message}"
|
||||||
|
exit 1
|
||||||
|
end
|
||||||
|
end
|
||||||
|
end
|
||||||
|
end
|
||||||
|
end
|
||||||
@@ -1,8 +1,13 @@
|
|||||||
# frozen_string_literal: true
|
# frozen_string_literal: true
|
||||||
|
|
||||||
module Uplot
|
module YouPlot
|
||||||
class Command
|
class Command
|
||||||
Params = Struct.new(
|
# UnicodePlot parameters.
|
||||||
|
# * Normally in a Ruby program, you might use hash for the parameter object.
|
||||||
|
# * Here, I use Struct for 2 safety reason.
|
||||||
|
# * The keys are static in Struct.
|
||||||
|
# * Struct does not conflict with keyword arguments. Hash dose.
|
||||||
|
PlotParams = Struct.new(
|
||||||
# Sort me!
|
# Sort me!
|
||||||
:title,
|
:title,
|
||||||
:width,
|
:width,
|
||||||
@@ -2,8 +2,9 @@
|
|||||||
|
|
||||||
require 'csv'
|
require 'csv'
|
||||||
|
|
||||||
module Uplot
|
module YouPlot
|
||||||
module Preprocessing
|
# Read and interpret Delimiter-separated values format file or stream.
|
||||||
|
module DSVReader
|
||||||
module_function
|
module_function
|
||||||
|
|
||||||
def input(input, delimiter, headers, transpose)
|
def input(input, delimiter, headers, transpose)
|
||||||
@@ -62,27 +63,11 @@ module Uplot
|
|||||||
else
|
else
|
||||||
arr
|
arr
|
||||||
end
|
end
|
||||||
|
elsif headers
|
||||||
|
transpose2(arr[1..-1])
|
||||||
else
|
else
|
||||||
if headers
|
transpose2(arr)
|
||||||
transpose2(arr[1..-1])
|
|
||||||
else
|
|
||||||
transpose2(arr)
|
|
||||||
end
|
|
||||||
end
|
end
|
||||||
end
|
end
|
||||||
|
|
||||||
def count(arr)
|
|
||||||
# tally was added in Ruby 2.7
|
|
||||||
if Enumerable.method_defined? :tally
|
|
||||||
arr.tally
|
|
||||||
else
|
|
||||||
# https://github.com/marcandre/backports
|
|
||||||
arr.each_with_object(Hash.new(0)) { |item, res| res[item] += 1 }
|
|
||||||
.tap { |h| h.default = nil }
|
|
||||||
end
|
|
||||||
.sort { |a, b| a[1] <=> b[1] }
|
|
||||||
.reverse
|
|
||||||
.transpose
|
|
||||||
end
|
|
||||||
end
|
end
|
||||||
end
|
end
|
||||||
@@ -1,5 +1,5 @@
|
|||||||
# frozen_string_literal: true
|
# frozen_string_literal: true
|
||||||
|
|
||||||
module Uplot
|
module YouPlot
|
||||||
VERSION = '0.2.4'
|
VERSION = '0.3.2'
|
||||||
end
|
end
|
||||||
151
test/fixtures/IRIStsv.tsv
vendored
Normal file
151
test/fixtures/IRIStsv.tsv
vendored
Normal file
@@ -0,0 +1,151 @@
|
|||||||
|
sepal_length sepal_width petal_length petal_width species
|
||||||
|
5.1 3.5 1.4 0.2 Iris-setosa
|
||||||
|
4.9 3 1.4 0.2 Iris-setosa
|
||||||
|
4.7 3.2 1.3 0.2 Iris-setosa
|
||||||
|
4.6 3.1 1.5 0.2 Iris-setosa
|
||||||
|
5 3.6 1.4 0.2 Iris-setosa
|
||||||
|
5.4 3.9 1.7 0.4 Iris-setosa
|
||||||
|
4.6 3.4 1.4 0.3 Iris-setosa
|
||||||
|
5 3.4 1.5 0.2 Iris-setosa
|
||||||
|
4.4 2.9 1.4 0.2 Iris-setosa
|
||||||
|
4.9 3.1 1.5 0.1 Iris-setosa
|
||||||
|
5.4 3.7 1.5 0.2 Iris-setosa
|
||||||
|
4.8 3.4 1.6 0.2 Iris-setosa
|
||||||
|
4.8 3 1.4 0.1 Iris-setosa
|
||||||
|
4.3 3 1.1 0.1 Iris-setosa
|
||||||
|
5.8 4 1.2 0.2 Iris-setosa
|
||||||
|
5.7 4.4 1.5 0.4 Iris-setosa
|
||||||
|
5.4 3.9 1.3 0.4 Iris-setosa
|
||||||
|
5.1 3.5 1.4 0.3 Iris-setosa
|
||||||
|
5.7 3.8 1.7 0.3 Iris-setosa
|
||||||
|
5.1 3.8 1.5 0.3 Iris-setosa
|
||||||
|
5.4 3.4 1.7 0.2 Iris-setosa
|
||||||
|
5.1 3.7 1.5 0.4 Iris-setosa
|
||||||
|
4.6 3.6 1 0.2 Iris-setosa
|
||||||
|
5.1 3.3 1.7 0.5 Iris-setosa
|
||||||
|
4.8 3.4 1.9 0.2 Iris-setosa
|
||||||
|
5 3 1.6 0.2 Iris-setosa
|
||||||
|
5 3.4 1.6 0.4 Iris-setosa
|
||||||
|
5.2 3.5 1.5 0.2 Iris-setosa
|
||||||
|
5.2 3.4 1.4 0.2 Iris-setosa
|
||||||
|
4.7 3.2 1.6 0.2 Iris-setosa
|
||||||
|
4.8 3.1 1.6 0.2 Iris-setosa
|
||||||
|
5.4 3.4 1.5 0.4 Iris-setosa
|
||||||
|
5.2 4.1 1.5 0.1 Iris-setosa
|
||||||
|
5.5 4.2 1.4 0.2 Iris-setosa
|
||||||
|
4.9 3.1 1.5 0.1 Iris-setosa
|
||||||
|
5 3.2 1.2 0.2 Iris-setosa
|
||||||
|
5.5 3.5 1.3 0.2 Iris-setosa
|
||||||
|
4.9 3.1 1.5 0.1 Iris-setosa
|
||||||
|
4.4 3 1.3 0.2 Iris-setosa
|
||||||
|
5.1 3.4 1.5 0.2 Iris-setosa
|
||||||
|
5 3.5 1.3 0.3 Iris-setosa
|
||||||
|
4.5 2.3 1.3 0.3 Iris-setosa
|
||||||
|
4.4 3.2 1.3 0.2 Iris-setosa
|
||||||
|
5 3.5 1.6 0.6 Iris-setosa
|
||||||
|
5.1 3.8 1.9 0.4 Iris-setosa
|
||||||
|
4.8 3 1.4 0.3 Iris-setosa
|
||||||
|
5.1 3.8 1.6 0.2 Iris-setosa
|
||||||
|
4.6 3.2 1.4 0.2 Iris-setosa
|
||||||
|
5.3 3.7 1.5 0.2 Iris-setosa
|
||||||
|
5 3.3 1.4 0.2 Iris-setosa
|
||||||
|
7 3.2 4.7 1.4 Iris-versicolor
|
||||||
|
6.4 3.2 4.5 1.5 Iris-versicolor
|
||||||
|
6.9 3.1 4.9 1.5 Iris-versicolor
|
||||||
|
5.5 2.3 4 1.3 Iris-versicolor
|
||||||
|
6.5 2.8 4.6 1.5 Iris-versicolor
|
||||||
|
5.7 2.8 4.5 1.3 Iris-versicolor
|
||||||
|
6.3 3.3 4.7 1.6 Iris-versicolor
|
||||||
|
4.9 2.4 3.3 1 Iris-versicolor
|
||||||
|
6.6 2.9 4.6 1.3 Iris-versicolor
|
||||||
|
5.2 2.7 3.9 1.4 Iris-versicolor
|
||||||
|
5 2 3.5 1 Iris-versicolor
|
||||||
|
5.9 3 4.2 1.5 Iris-versicolor
|
||||||
|
6 2.2 4 1 Iris-versicolor
|
||||||
|
6.1 2.9 4.7 1.4 Iris-versicolor
|
||||||
|
5.6 2.9 3.6 1.3 Iris-versicolor
|
||||||
|
6.7 3.1 4.4 1.4 Iris-versicolor
|
||||||
|
5.6 3 4.5 1.5 Iris-versicolor
|
||||||
|
5.8 2.7 4.1 1 Iris-versicolor
|
||||||
|
6.2 2.2 4.5 1.5 Iris-versicolor
|
||||||
|
5.6 2.5 3.9 1.1 Iris-versicolor
|
||||||
|
5.9 3.2 4.8 1.8 Iris-versicolor
|
||||||
|
6.1 2.8 4 1.3 Iris-versicolor
|
||||||
|
6.3 2.5 4.9 1.5 Iris-versicolor
|
||||||
|
6.1 2.8 4.7 1.2 Iris-versicolor
|
||||||
|
6.4 2.9 4.3 1.3 Iris-versicolor
|
||||||
|
6.6 3 4.4 1.4 Iris-versicolor
|
||||||
|
6.8 2.8 4.8 1.4 Iris-versicolor
|
||||||
|
6.7 3 5 1.7 Iris-versicolor
|
||||||
|
6 2.9 4.5 1.5 Iris-versicolor
|
||||||
|
5.7 2.6 3.5 1 Iris-versicolor
|
||||||
|
5.5 2.4 3.8 1.1 Iris-versicolor
|
||||||
|
5.5 2.4 3.7 1 Iris-versicolor
|
||||||
|
5.8 2.7 3.9 1.2 Iris-versicolor
|
||||||
|
6 2.7 5.1 1.6 Iris-versicolor
|
||||||
|
5.4 3 4.5 1.5 Iris-versicolor
|
||||||
|
6 3.4 4.5 1.6 Iris-versicolor
|
||||||
|
6.7 3.1 4.7 1.5 Iris-versicolor
|
||||||
|
6.3 2.3 4.4 1.3 Iris-versicolor
|
||||||
|
5.6 3 4.1 1.3 Iris-versicolor
|
||||||
|
5.5 2.5 4 1.3 Iris-versicolor
|
||||||
|
5.5 2.6 4.4 1.2 Iris-versicolor
|
||||||
|
6.1 3 4.6 1.4 Iris-versicolor
|
||||||
|
5.8 2.6 4 1.2 Iris-versicolor
|
||||||
|
5 2.3 3.3 1 Iris-versicolor
|
||||||
|
5.6 2.7 4.2 1.3 Iris-versicolor
|
||||||
|
5.7 3 4.2 1.2 Iris-versicolor
|
||||||
|
5.7 2.9 4.2 1.3 Iris-versicolor
|
||||||
|
6.2 2.9 4.3 1.3 Iris-versicolor
|
||||||
|
5.1 2.5 3 1.1 Iris-versicolor
|
||||||
|
5.7 2.8 4.1 1.3 Iris-versicolor
|
||||||
|
6.3 3.3 6 2.5 Iris-virginica
|
||||||
|
5.8 2.7 5.1 1.9 Iris-virginica
|
||||||
|
7.1 3 5.9 2.1 Iris-virginica
|
||||||
|
6.3 2.9 5.6 1.8 Iris-virginica
|
||||||
|
6.5 3 5.8 2.2 Iris-virginica
|
||||||
|
7.6 3 6.6 2.1 Iris-virginica
|
||||||
|
4.9 2.5 4.5 1.7 Iris-virginica
|
||||||
|
7.3 2.9 6.3 1.8 Iris-virginica
|
||||||
|
6.7 2.5 5.8 1.8 Iris-virginica
|
||||||
|
7.2 3.6 6.1 2.5 Iris-virginica
|
||||||
|
6.5 3.2 5.1 2 Iris-virginica
|
||||||
|
6.4 2.7 5.3 1.9 Iris-virginica
|
||||||
|
6.8 3 5.5 2.1 Iris-virginica
|
||||||
|
5.7 2.5 5 2 Iris-virginica
|
||||||
|
5.8 2.8 5.1 2.4 Iris-virginica
|
||||||
|
6.4 3.2 5.3 2.3 Iris-virginica
|
||||||
|
6.5 3 5.5 1.8 Iris-virginica
|
||||||
|
7.7 3.8 6.7 2.2 Iris-virginica
|
||||||
|
7.7 2.6 6.9 2.3 Iris-virginica
|
||||||
|
6 2.2 5 1.5 Iris-virginica
|
||||||
|
6.9 3.2 5.7 2.3 Iris-virginica
|
||||||
|
5.6 2.8 4.9 2 Iris-virginica
|
||||||
|
7.7 2.8 6.7 2 Iris-virginica
|
||||||
|
6.3 2.7 4.9 1.8 Iris-virginica
|
||||||
|
6.7 3.3 5.7 2.1 Iris-virginica
|
||||||
|
7.2 3.2 6 1.8 Iris-virginica
|
||||||
|
6.2 2.8 4.8 1.8 Iris-virginica
|
||||||
|
6.1 3 4.9 1.8 Iris-virginica
|
||||||
|
6.4 2.8 5.6 2.1 Iris-virginica
|
||||||
|
7.2 3 5.8 1.6 Iris-virginica
|
||||||
|
7.4 2.8 6.1 1.9 Iris-virginica
|
||||||
|
7.9 3.8 6.4 2 Iris-virginica
|
||||||
|
6.4 2.8 5.6 2.2 Iris-virginica
|
||||||
|
6.3 2.8 5.1 1.5 Iris-virginica
|
||||||
|
6.1 2.6 5.6 1.4 Iris-virginica
|
||||||
|
7.7 3 6.1 2.3 Iris-virginica
|
||||||
|
6.3 3.4 5.6 2.4 Iris-virginica
|
||||||
|
6.4 3.1 5.5 1.8 Iris-virginica
|
||||||
|
6 3 4.8 1.8 Iris-virginica
|
||||||
|
6.9 3.1 5.4 2.1 Iris-virginica
|
||||||
|
6.7 3.1 5.6 2.4 Iris-virginica
|
||||||
|
6.9 3.1 5.1 2.3 Iris-virginica
|
||||||
|
5.8 2.7 5.1 1.9 Iris-virginica
|
||||||
|
6.8 3.2 5.9 2.3 Iris-virginica
|
||||||
|
6.7 3.3 5.7 2.5 Iris-virginica
|
||||||
|
6.7 3 5.2 2.3 Iris-virginica
|
||||||
|
6.3 2.5 5 1.9 Iris-virginica
|
||||||
|
6.5 3 5.2 2 Iris-virginica
|
||||||
|
6.2 3.4 5.4 2.3 Iris-virginica
|
||||||
|
5.9 3 5.1 1.8 Iris-virginica
|
||||||
|
1
test/fixtures/colors.txt
vendored
Normal file
1
test/fixtures/colors.txt
vendored
Normal file
File diff suppressed because one or more lines are too long
153
test/fixtures/iris-barplot.txt
vendored
Normal file
153
test/fixtures/iris-barplot.txt
vendored
Normal file
@@ -0,0 +1,153 @@
|
|||||||
|
IRIS-BARPLOT
|
||||||
|
┌ ┐
|
||||||
|
5.1 ┤■■■■■■■■■■■■■■■■■■■■■■■■■■■■ 3.5
|
||||||
|
4.9 ┤■■■■■■■■■■■■■■■■■■■■■■■■ 3.0
|
||||||
|
4.7 ┤■■■■■■■■■■■■■■■■■■■■■■■■■ 3.2
|
||||||
|
4.6 ┤■■■■■■■■■■■■■■■■■■■■■■■■■ 3.1
|
||||||
|
5.0 ┤■■■■■■■■■■■■■■■■■■■■■■■■■■■■■ 3.6
|
||||||
|
5.4 ┤■■■■■■■■■■■■■■■■■■■■■■■■■■■■■■■ 3.9
|
||||||
|
4.6 ┤■■■■■■■■■■■■■■■■■■■■■■■■■■■ 3.4
|
||||||
|
5.0 ┤■■■■■■■■■■■■■■■■■■■■■■■■■■■ 3.4
|
||||||
|
4.4 ┤■■■■■■■■■■■■■■■■■■■■■■■ 2.9
|
||||||
|
4.9 ┤■■■■■■■■■■■■■■■■■■■■■■■■■ 3.1
|
||||||
|
5.4 ┤■■■■■■■■■■■■■■■■■■■■■■■■■■■■■ 3.7
|
||||||
|
4.8 ┤■■■■■■■■■■■■■■■■■■■■■■■■■■■ 3.4
|
||||||
|
4.8 ┤■■■■■■■■■■■■■■■■■■■■■■■■ 3.0
|
||||||
|
4.3 ┤■■■■■■■■■■■■■■■■■■■■■■■■ 3.0
|
||||||
|
5.8 ┤■■■■■■■■■■■■■■■■■■■■■■■■■■■■■■■■ 4.0
|
||||||
|
5.7 ┤■■■■■■■■■■■■■■■■■■■■■■■■■■■■■■■■■■■ 4.4
|
||||||
|
5.4 ┤■■■■■■■■■■■■■■■■■■■■■■■■■■■■■■■ 3.9
|
||||||
|
5.1 ┤■■■■■■■■■■■■■■■■■■■■■■■■■■■■ 3.5
|
||||||
|
5.7 ┤■■■■■■■■■■■■■■■■■■■■■■■■■■■■■■ 3.8
|
||||||
|
5.1 ┤■■■■■■■■■■■■■■■■■■■■■■■■■■■■■■ 3.8
|
||||||
|
5.4 ┤■■■■■■■■■■■■■■■■■■■■■■■■■■■ 3.4
|
||||||
|
5.1 ┤■■■■■■■■■■■■■■■■■■■■■■■■■■■■■ 3.7
|
||||||
|
4.6 ┤■■■■■■■■■■■■■■■■■■■■■■■■■■■■■ 3.6
|
||||||
|
5.1 ┤■■■■■■■■■■■■■■■■■■■■■■■■■■ 3.3
|
||||||
|
4.8 ┤■■■■■■■■■■■■■■■■■■■■■■■■■■■ 3.4
|
||||||
|
5.0 ┤■■■■■■■■■■■■■■■■■■■■■■■■ 3.0
|
||||||
|
5.0 ┤■■■■■■■■■■■■■■■■■■■■■■■■■■■ 3.4
|
||||||
|
5.2 ┤■■■■■■■■■■■■■■■■■■■■■■■■■■■■ 3.5
|
||||||
|
5.2 ┤■■■■■■■■■■■■■■■■■■■■■■■■■■■ 3.4
|
||||||
|
4.7 ┤■■■■■■■■■■■■■■■■■■■■■■■■■ 3.2
|
||||||
|
4.8 ┤■■■■■■■■■■■■■■■■■■■■■■■■■ 3.1
|
||||||
|
5.4 ┤■■■■■■■■■■■■■■■■■■■■■■■■■■■ 3.4
|
||||||
|
5.2 ┤■■■■■■■■■■■■■■■■■■■■■■■■■■■■■■■■■ 4.1
|
||||||
|
5.5 ┤■■■■■■■■■■■■■■■■■■■■■■■■■■■■■■■■■ 4.2
|
||||||
|
4.9 ┤■■■■■■■■■■■■■■■■■■■■■■■■■ 3.1
|
||||||
|
5.0 ┤■■■■■■■■■■■■■■■■■■■■■■■■■ 3.2
|
||||||
|
5.5 ┤■■■■■■■■■■■■■■■■■■■■■■■■■■■■ 3.5
|
||||||
|
4.9 ┤■■■■■■■■■■■■■■■■■■■■■■■■■ 3.1
|
||||||
|
4.4 ┤■■■■■■■■■■■■■■■■■■■■■■■■ 3.0
|
||||||
|
5.1 ┤■■■■■■■■■■■■■■■■■■■■■■■■■■■ 3.4
|
||||||
|
5.0 ┤■■■■■■■■■■■■■■■■■■■■■■■■■■■■ 3.5
|
||||||
|
4.5 ┤■■■■■■■■■■■■■■■■■■ 2.3
|
||||||
|
4.4 ┤■■■■■■■■■■■■■■■■■■■■■■■■■ 3.2
|
||||||
|
5.0 ┤■■■■■■■■■■■■■■■■■■■■■■■■■■■■ 3.5
|
||||||
|
5.1 ┤■■■■■■■■■■■■■■■■■■■■■■■■■■■■■■ 3.8
|
||||||
|
4.8 ┤■■■■■■■■■■■■■■■■■■■■■■■■ 3.0
|
||||||
|
5.1 ┤■■■■■■■■■■■■■■■■■■■■■■■■■■■■■■ 3.8
|
||||||
|
4.6 ┤■■■■■■■■■■■■■■■■■■■■■■■■■ 3.2
|
||||||
|
5.3 ┤■■■■■■■■■■■■■■■■■■■■■■■■■■■■■ 3.7
|
||||||
|
5.0 ┤■■■■■■■■■■■■■■■■■■■■■■■■■■ 3.3
|
||||||
|
7.0 ┤■■■■■■■■■■■■■■■■■■■■■■■■■ 3.2
|
||||||
|
6.4 ┤■■■■■■■■■■■■■■■■■■■■■■■■■ 3.2
|
||||||
|
6.9 ┤■■■■■■■■■■■■■■■■■■■■■■■■■ 3.1
|
||||||
|
5.5 ┤■■■■■■■■■■■■■■■■■■ 2.3
|
||||||
|
6.5 ┤■■■■■■■■■■■■■■■■■■■■■■ 2.8
|
||||||
|
5.7 ┤■■■■■■■■■■■■■■■■■■■■■■ 2.8
|
||||||
|
6.3 ┤■■■■■■■■■■■■■■■■■■■■■■■■■■ 3.3
|
||||||
|
4.9 ┤■■■■■■■■■■■■■■■■■■■ 2.4
|
||||||
|
6.6 ┤■■■■■■■■■■■■■■■■■■■■■■■ 2.9
|
||||||
|
5.2 ┤■■■■■■■■■■■■■■■■■■■■■ 2.7
|
||||||
|
5.0 ┤■■■■■■■■■■■■■■■■ 2.0
|
||||||
|
5.9 ┤■■■■■■■■■■■■■■■■■■■■■■■■ 3.0
|
||||||
|
6.0 ┤■■■■■■■■■■■■■■■■■■ 2.2
|
||||||
|
6.1 ┤■■■■■■■■■■■■■■■■■■■■■■■ 2.9
|
||||||
|
5.6 ┤■■■■■■■■■■■■■■■■■■■■■■■ 2.9
|
||||||
|
6.7 ┤■■■■■■■■■■■■■■■■■■■■■■■■■ 3.1
|
||||||
|
5.6 ┤■■■■■■■■■■■■■■■■■■■■■■■■ 3.0
|
||||||
|
5.8 ┤■■■■■■■■■■■■■■■■■■■■■ 2.7
|
||||||
|
6.2 ┤■■■■■■■■■■■■■■■■■■ 2.2
|
||||||
|
5.6 ┤■■■■■■■■■■■■■■■■■■■■ 2.5
|
||||||
|
5.9 ┤■■■■■■■■■■■■■■■■■■■■■■■■■ 3.2
|
||||||
|
6.1 ┤■■■■■■■■■■■■■■■■■■■■■■ 2.8
|
||||||
|
6.3 ┤■■■■■■■■■■■■■■■■■■■■ 2.5
|
||||||
|
6.1 ┤■■■■■■■■■■■■■■■■■■■■■■ 2.8
|
||||||
|
6.4 ┤■■■■■■■■■■■■■■■■■■■■■■■ 2.9
|
||||||
|
6.6 ┤■■■■■■■■■■■■■■■■■■■■■■■■ 3.0
|
||||||
|
6.8 ┤■■■■■■■■■■■■■■■■■■■■■■ 2.8
|
||||||
|
6.7 ┤■■■■■■■■■■■■■■■■■■■■■■■■ 3.0
|
||||||
|
6.0 ┤■■■■■■■■■■■■■■■■■■■■■■■ 2.9
|
||||||
|
5.7 ┤■■■■■■■■■■■■■■■■■■■■■ 2.6
|
||||||
|
5.5 ┤■■■■■■■■■■■■■■■■■■■ 2.4
|
||||||
|
5.5 ┤■■■■■■■■■■■■■■■■■■■ 2.4
|
||||||
|
5.8 ┤■■■■■■■■■■■■■■■■■■■■■ 2.7
|
||||||
|
6.0 ┤■■■■■■■■■■■■■■■■■■■■■ 2.7
|
||||||
|
5.4 ┤■■■■■■■■■■■■■■■■■■■■■■■■ 3.0
|
||||||
|
6.0 ┤■■■■■■■■■■■■■■■■■■■■■■■■■■■ 3.4
|
||||||
|
6.7 ┤■■■■■■■■■■■■■■■■■■■■■■■■■ 3.1
|
||||||
|
6.3 ┤■■■■■■■■■■■■■■■■■■ 2.3
|
||||||
|
5.6 ┤■■■■■■■■■■■■■■■■■■■■■■■■ 3.0
|
||||||
|
5.5 ┤■■■■■■■■■■■■■■■■■■■■ 2.5
|
||||||
|
5.5 ┤■■■■■■■■■■■■■■■■■■■■■ 2.6
|
||||||
|
6.1 ┤■■■■■■■■■■■■■■■■■■■■■■■■ 3.0
|
||||||
|
5.8 ┤■■■■■■■■■■■■■■■■■■■■■ 2.6
|
||||||
|
5.0 ┤■■■■■■■■■■■■■■■■■■ 2.3
|
||||||
|
5.6 ┤■■■■■■■■■■■■■■■■■■■■■ 2.7
|
||||||
|
5.7 ┤■■■■■■■■■■■■■■■■■■■■■■■■ 3.0
|
||||||
|
5.7 ┤■■■■■■■■■■■■■■■■■■■■■■■ 2.9
|
||||||
|
6.2 ┤■■■■■■■■■■■■■■■■■■■■■■■ 2.9
|
||||||
|
5.1 ┤■■■■■■■■■■■■■■■■■■■■ 2.5
|
||||||
|
5.7 ┤■■■■■■■■■■■■■■■■■■■■■■ 2.8
|
||||||
|
6.3 ┤■■■■■■■■■■■■■■■■■■■■■■■■■■ 3.3
|
||||||
|
5.8 ┤■■■■■■■■■■■■■■■■■■■■■ 2.7
|
||||||
|
7.1 ┤■■■■■■■■■■■■■■■■■■■■■■■■ 3.0
|
||||||
|
6.3 ┤■■■■■■■■■■■■■■■■■■■■■■■ 2.9
|
||||||
|
6.5 ┤■■■■■■■■■■■■■■■■■■■■■■■■ 3.0
|
||||||
|
7.6 ┤■■■■■■■■■■■■■■■■■■■■■■■■ 3.0
|
||||||
|
4.9 ┤■■■■■■■■■■■■■■■■■■■■ 2.5
|
||||||
|
7.3 ┤■■■■■■■■■■■■■■■■■■■■■■■ 2.9
|
||||||
|
6.7 ┤■■■■■■■■■■■■■■■■■■■■ 2.5
|
||||||
|
7.2 ┤■■■■■■■■■■■■■■■■■■■■■■■■■■■■■ 3.6
|
||||||
|
6.5 ┤■■■■■■■■■■■■■■■■■■■■■■■■■ 3.2
|
||||||
|
6.4 ┤■■■■■■■■■■■■■■■■■■■■■ 2.7
|
||||||
|
6.8 ┤■■■■■■■■■■■■■■■■■■■■■■■■ 3.0
|
||||||
|
5.7 ┤■■■■■■■■■■■■■■■■■■■■ 2.5
|
||||||
|
5.8 ┤■■■■■■■■■■■■■■■■■■■■■■ 2.8
|
||||||
|
6.4 ┤■■■■■■■■■■■■■■■■■■■■■■■■■ 3.2
|
||||||
|
6.5 ┤■■■■■■■■■■■■■■■■■■■■■■■■ 3.0
|
||||||
|
7.7 ┤■■■■■■■■■■■■■■■■■■■■■■■■■■■■■■ 3.8
|
||||||
|
7.7 ┤■■■■■■■■■■■■■■■■■■■■■ 2.6
|
||||||
|
6.0 ┤■■■■■■■■■■■■■■■■■■ 2.2
|
||||||
|
6.9 ┤■■■■■■■■■■■■■■■■■■■■■■■■■ 3.2
|
||||||
|
5.6 ┤■■■■■■■■■■■■■■■■■■■■■■ 2.8
|
||||||
|
7.7 ┤■■■■■■■■■■■■■■■■■■■■■■ 2.8
|
||||||
|
6.3 ┤■■■■■■■■■■■■■■■■■■■■■ 2.7
|
||||||
|
6.7 ┤■■■■■■■■■■■■■■■■■■■■■■■■■■ 3.3
|
||||||
|
7.2 ┤■■■■■■■■■■■■■■■■■■■■■■■■■ 3.2
|
||||||
|
6.2 ┤■■■■■■■■■■■■■■■■■■■■■■ 2.8
|
||||||
|
6.1 ┤■■■■■■■■■■■■■■■■■■■■■■■■ 3.0
|
||||||
|
6.4 ┤■■■■■■■■■■■■■■■■■■■■■■ 2.8
|
||||||
|
7.2 ┤■■■■■■■■■■■■■■■■■■■■■■■■ 3.0
|
||||||
|
7.4 ┤■■■■■■■■■■■■■■■■■■■■■■ 2.8
|
||||||
|
7.9 ┤■■■■■■■■■■■■■■■■■■■■■■■■■■■■■■ 3.8
|
||||||
|
6.4 ┤■■■■■■■■■■■■■■■■■■■■■■ 2.8
|
||||||
|
6.3 ┤■■■■■■■■■■■■■■■■■■■■■■ 2.8
|
||||||
|
6.1 ┤■■■■■■■■■■■■■■■■■■■■■ 2.6
|
||||||
|
7.7 ┤■■■■■■■■■■■■■■■■■■■■■■■■ 3.0
|
||||||
|
6.3 ┤■■■■■■■■■■■■■■■■■■■■■■■■■■■ 3.4
|
||||||
|
6.4 ┤■■■■■■■■■■■■■■■■■■■■■■■■■ 3.1
|
||||||
|
6.0 ┤■■■■■■■■■■■■■■■■■■■■■■■■ 3.0
|
||||||
|
6.9 ┤■■■■■■■■■■■■■■■■■■■■■■■■■ 3.1
|
||||||
|
6.7 ┤■■■■■■■■■■■■■■■■■■■■■■■■■ 3.1
|
||||||
|
6.9 ┤■■■■■■■■■■■■■■■■■■■■■■■■■ 3.1
|
||||||
|
5.8 ┤■■■■■■■■■■■■■■■■■■■■■ 2.7
|
||||||
|
6.8 ┤■■■■■■■■■■■■■■■■■■■■■■■■■ 3.2
|
||||||
|
6.7 ┤■■■■■■■■■■■■■■■■■■■■■■■■■■ 3.3
|
||||||
|
6.7 ┤■■■■■■■■■■■■■■■■■■■■■■■■ 3.0
|
||||||
|
6.3 ┤■■■■■■■■■■■■■■■■■■■■ 2.5
|
||||||
|
6.5 ┤■■■■■■■■■■■■■■■■■■■■■■■■ 3.0
|
||||||
|
6.2 ┤■■■■■■■■■■■■■■■■■■■■■■■■■■■ 3.4
|
||||||
|
5.9 ┤■■■■■■■■■■■■■■■■■■■■■■■■ 3.0
|
||||||
|
└ ┘
|
||||||
19
test/fixtures/iris-boxplot.txt
vendored
Normal file
19
test/fixtures/iris-boxplot.txt
vendored
Normal file
@@ -0,0 +1,19 @@
|
|||||||
|
IRIS-BOXPLOT
|
||||||
|
┌ ┐
|
||||||
|
╷ ┌──┬──┐ ╷
|
||||||
|
sepal_length ├───┤ │ ├───────┤
|
||||||
|
╵ └──┴──┘ ╵
|
||||||
|
╷ ┌┬┐ ╷
|
||||||
|
sepal_width ├───┤│├─────┤
|
||||||
|
╵ └┴┘ ╵
|
||||||
|
╷ ┌─────────────┬───┐ ╷
|
||||||
|
petal_length ├──┤ │ ├───────┤
|
||||||
|
╵ └─────────────┴───┘ ╵
|
||||||
|
╷┌───┬──┐ ╷
|
||||||
|
petal_width ├┤ │ ├──┤
|
||||||
|
╵└───┴──┘ ╵
|
||||||
|
╷
|
||||||
|
species ┤
|
||||||
|
╵
|
||||||
|
└ ┘
|
||||||
|
0 4 8
|
||||||
20
test/fixtures/iris-density.txt
vendored
Normal file
20
test/fixtures/iris-density.txt
vendored
Normal file
@@ -0,0 +1,20 @@
|
|||||||
|
IRIS-DENSITY
|
||||||
|
┌────────────────────────────────────────┐
|
||||||
|
6.9 │ │ sepal_width
|
||||||
|
│ │ petal_length
|
||||||
|
│ │ petal_width
|
||||||
|
│ │ species
|
||||||
|
│ ░ │
|
||||||
|
│ │
|
||||||
|
│ ░ │
|
||||||
|
│ ░ │
|
||||||
|
│ ░ ░ ░░ ░ │
|
||||||
|
│ ░ ░ ░ │
|
||||||
|
│ │
|
||||||
|
│ ░ ░▒ ░ ░ ░ ░ │
|
||||||
|
│ ░ ░ ░ │
|
||||||
|
│ │
|
||||||
|
0 │ ░░ ▒ ░█ ░ ░▒ ░░ ░ ░░░ ░ │
|
||||||
|
└────────────────────────────────────────┘
|
||||||
|
4 8
|
||||||
|
sepal_length
|
||||||
12
test/fixtures/iris-histogram.txt
vendored
Normal file
12
test/fixtures/iris-histogram.txt
vendored
Normal file
@@ -0,0 +1,12 @@
|
|||||||
|
IRIS-HISTOGRAM
|
||||||
|
┌ ┐
|
||||||
|
[4.0, 4.5) ┤▇▇▇▇▇ 4
|
||||||
|
[4.5, 5.0) ┤▇▇▇▇▇▇▇▇▇▇▇▇▇▇▇▇▇▇▇▇ 18
|
||||||
|
[5.0, 5.5) ┤▇▇▇▇▇▇▇▇▇▇▇▇▇▇▇▇▇▇▇▇▇▇▇▇▇▇▇▇▇▇▇▇▇▇ 30
|
||||||
|
[5.5, 6.0) ┤▇▇▇▇▇▇▇▇▇▇▇▇▇▇▇▇▇▇▇▇▇▇▇▇▇▇▇▇▇▇▇▇▇▇▇ 31
|
||||||
|
[6.0, 6.5) ┤▇▇▇▇▇▇▇▇▇▇▇▇▇▇▇▇▇▇▇▇▇▇▇▇▇▇▇▇▇▇▇▇▇▇▇▇ 32
|
||||||
|
[6.5, 7.0) ┤▇▇▇▇▇▇▇▇▇▇▇▇▇▇▇▇▇▇▇▇▇▇▇▇▇ 22
|
||||||
|
[7.0, 7.5) ┤▇▇▇▇▇▇▇▇ 7
|
||||||
|
[7.5, 8.0) ┤▇▇▇▇▇▇▇ 6
|
||||||
|
└ ┘
|
||||||
|
Frequency
|
||||||
20
test/fixtures/iris-lineplot.txt
vendored
Normal file
20
test/fixtures/iris-lineplot.txt
vendored
Normal file
@@ -0,0 +1,20 @@
|
|||||||
|
IRIS-LINEPLOT
|
||||||
|
┌────────────────────────────────────────┐
|
||||||
|
5 │⠀⠀⠀⠀⠀⠀⠀⠀⠀⠀⠀⠀⠀⠀⠀⠀⠀⠀⠀⠀⠀⠀⠀⠀⠀⠀⠀⠀⠀⠀⠀⠀⠀⠀⠀⠀⠀⠀⠀⠀│
|
||||||
|
│⠀⠀⠀⠀⠀⠀⠀⠀⠀⠀⠀⠀⠀⠀⠀⠀⠀⠀⠀⠀⠀⠀⠀⠀⠀⠀⠀⠀⠀⠀⠀⠀⠀⠀⠀⠀⠀⠀⠀⠀│
|
||||||
|
│⠀⠀⠀⠀⠀⠀⠀⠀⠀⠀⠀⠀⠀⠀⠀⠀⠀⡀⠀⠀⠀⠀⠀⠀⠀⠀⠀⠀⠀⠀⠀⠀⠀⠀⠀⠀⠀⠀⠀⠀│
|
||||||
|
│⠀⠀⠀⠀⠀⠀⠀⠀⠀⠀⠀⠀⠀⠀⠀⢀⠎⡇⠀⠀⠀⠀⠀⠀⠀⠀⠀⠀⠀⠀⠀⠀⠀⠀⠀⠀⠀⠀⠀⠀│
|
||||||
|
│⠀⠀⠀⠀⠀⠀⠀⠀⠀⠀⠀⠀⡔⠒⣽⠋⠀⢸⠀⠀⠀⠀⠀⠀⠀⠀⠀⠀⠀⠀⠀⠀⠀⠀⠀⠀⠀⠀⠀⠀│
|
||||||
|
│⠀⠀⠀⠀⠀⠀⠀⠀⠀⠀⠀⠀⢣⣼⠇⡠⠠⠊⠁⠀⠀⠀⠀⠀⠀⠀⠀⠀⠀⠀⠀⠀⠀⠀⠀⠀⠀⠀⠀⠀│
|
||||||
|
│⠀⠀⠀⠀⠀⢀⣀⣀⠤⢤⣼⢿⣿⣿⠯⠛⠉⠁⠀⠀⠀⠀⠀⠀⠀⠀⠀⠀⠀⠀⠀⠀⠀⠀⢀⠤⢊⡧⡺⠁│
|
||||||
|
sepal_width │⠀⠀⠀⠀⠀⠈⢑⠦⣺⣵⣿⣿⡝⢵⡠⠆⠀⠀⠀⠀⠀⠀⠀⠀⠀⠀⠀⠀⠀⡠⠔⣺⠥⢊⠥⠊⠁⡷⠁⠀│
|
||||||
|
│⠀⠀⠀⠀⢀⡨⡽⣿⣯⢟⣿⡯⠿⠭⠥⠤⠤⢤⠤⠮⢍⣕⣣⣏⣉⣒⣦⣶⣭⣤⣺⣥⠊⠁⠀⠀⡰⡇⠀⠀│
|
||||||
|
│⠀⠀⠀⡠⣗⣭⣞⣿⣾⣟⡇⠀⠀⠀⢀⠤⢊⣁⣰⣣⣾⣟⣥⣾⣿⣽⢿⣿⡿⡿⠛⠉⠓⠢⠤⣴⣁⡇⠀⠀│
|
||||||
|
│⠀⠀⠈⠉⡟⠋⠉⡝⠀⠉⠁⠀⠀⠀⠉⢺⣷⣷⢿⣿⣿⣿⣷⣾⣿⣿⣿⣿⣿⣿⣯⢿⡿⢟⡻⠋⠉⡇⠀⠀│
|
||||||
|
│⠀⠀⠀⠀⢱⠀⡰⠁⠀⠀⠀⢀⢖⣶⣾⣿⣿⣻⡿⣿⣿⣿⣿⢿⣿⠟⠛⢻⢛⡻⠛⠉⠉⠉⠉⠉⠉⡇⠀⠀│
|
||||||
|
│⠀⠀⠀⠀⢸⢠⠃⠀⠀⢔⣶⡾⡿⣟⡿⢿⠷⣟⡿⢿⡟⢅⡱⢏⠎⠀⠀⠗⢁⣀⣀⠤⠤⠒⠒⠉⠉⠁⠀⠀│
|
||||||
|
│⠀⠀⠀⠀⠸⠇⠀⠀⠀⠁⢴⠋⡩⠊⠀⠗⠋⠁⠉⢺⣷⣎⡱⠮⠔⠒⠊⠉⠁⠀⠀⠀⠀⠀⠀⠀⠀⠀⠀⠀│
|
||||||
|
2 │⠀⠀⠀⠀⠀⠀⠀⠀⠀⠀⡮⠊⠀⠀⠀⠀⠀⠀⠀⠀⠁⠈⠁⠀⠀⠀⠀⠀⠀⠀⠀⠀⠀⠀⠀⠀⠀⠀⠀⠀│
|
||||||
|
└────────────────────────────────────────┘
|
||||||
|
4 8
|
||||||
|
sepal_length
|
||||||
20
test/fixtures/iris-lineplots.txt
vendored
Normal file
20
test/fixtures/iris-lineplots.txt
vendored
Normal file
@@ -0,0 +1,20 @@
|
|||||||
|
IRIS-LINEPLOTS
|
||||||
|
┌────────────────────────────────────────┐
|
||||||
|
6.9 │⠀⠀⠀⠀⠀⠀⠀⠀⠀⠀⠀⠀⠀⠀⠀⠀⠀⠀⠀⠀⠀⠀⠀⠀⠀⠀⠀⠀⠀⠀⠀⠀⠀⣀⣤⣲⠭⠃⠀⠀│ sepal_width
|
||||||
|
│⠀⠀⠀⠀⠀⠀⠀⠀⠀⠀⠀⠀⠀⠀⠀⠀⠀⠀⠀⠀⠀⠀⠀⡀⠀⠀⠀⢀⣀⣠⣤⣶⣿⣿⣯⣴⣒⠖⠉⠁│ petal_length
|
||||||
|
│⠀⠀⠀⠀⠀⠀⠀⠀⠀⠀⠀⠀⠀⠀⠀⠀⠀⠀⠀⠀⢀⣤⢮⣤⣤⣶⣿⣿⣿⠿⠛⠛⠋⠉⠀⠀⠀⠀⠀⠀│ petal_width
|
||||||
|
│⠀⠀⠀⠀⠀⠀⠀⠀⠀⠀⠀⠀⠀⠀⠀⠀⢀⣀⣤⣴⣷⣿⣿⣿⣿⣿⣿⣟⣟⡂⠀⠀⠀⠀⠀⠀⠀⠀⠀⠀│ species
|
||||||
|
│⠀⠀⠀⠀⠀⠀⠀⠀⠀⠀⢀⣀⠤⠔⠒⢙⡻⠝⢋⡽⢝⣳⣾⣫⣥⣒⣪⣵⣖⣂⡀⠀⠀⠀⠀⠀⠀⠀⠀⠀│
|
||||||
|
│⠀⠀⠀⠀⠀⠀⠀⠀⠀⠉⠁⠀⠀⢀⣉⣟⣻⣿⣻⣿⣿⣿⠿⣿⣿⠿⠟⡢⠒⠁⠀⠀⠀⠀⠀⠀⠀⠀⠀⠀│
|
||||||
|
│⠀⠀⠀⠀⠀⠀⠀⠀⠀⠀⣠⣤⣿⣷⣾⣿⡿⣿⡯⠿⠛⠋⠉⠀⣀⠔⠉⠀⠀⠀⠀⠀⠀⠀⠀⢀⣀⣄⣀⠄│
|
||||||
|
│⠀⠀⠀⠀⢀⣨⣽⣿⣿⣿⣿⣿⣿⣿⣵⣚⣉⣃⣀⣠⣤⣤⣔⣮⣤⣄⣀⣠⣤⣔⣲⣾⡳⠮⠛⠋⢉⡗⠁⠀│
|
||||||
|
│⠀⠀⠐⠒⡿⠿⠟⡻⠛⠛⠛⠚⠉⠀⠲⣶⣿⣷⣾⣷⣿⣿⣷⣿⣿⣿⣿⣿⣿⣿⣿⣿⣿⣷⣶⣶⣷⡇⠀⠀│
|
||||||
|
│⠀⠀⠀⠀⢱⡠⠊⠀⠀⣤⣤⣶⣿⣿⠿⣿⣿⣿⣿⣿⣟⣿⣿⣟⣟⣉⣉⣝⣛⣫⣭⣥⣤⣤⣔⣒⣒⡃⠀⠀│
|
||||||
|
│⠀⠀⠀⠀⠀⠁⠀⢀⡀⠀⢯⠒⠉⡠⠔⠡⠤⠮⣤⣴⣿⣿⣿⣿⣿⣿⣿⣿⣿⣷⣿⣶⣶⣶⣶⣿⣿⠥⠤⠄│
|
||||||
|
│⠀⠀⠀⠀⣀⣠⣄⣤⣭⣿⣿⣿⣿⣿⣿⣿⣿⣯⣯⣯⣭⣽⣿⣿⣿⣿⣿⣯⣭⣍⡙⠛⠝⠉⠀⠀⠀⠀⠀⠀│
|
||||||
|
│⠀⠀⠠⠴⠿⢯⠭⠿⠯⣭⣷⡾⠿⠿⠿⣿⢿⡿⡻⠿⡟⠛⢛⣛⠯⠭⠒⠒⠉⠉⠀⠀⠀⠀⠀⠀⠀⠀⠀⠀│
|
||||||
|
│⠀⠀⠀⠀⠀⠀⠀⠀⣀⣀⣄⠀⠀⠀⢀⣀⡠⠤⠔⠒⠊⠉⠁⠀⠀⠀⠀⠀⠀⠀⠀⠀⠀⠀⠀⠀⠀⠀⠀⠀│
|
||||||
|
0 │⠀⠀⢀⣀⣴⣶⣾⣿⣿⣿⣿⣿⣿⣿⣿⣿⣻⣷⣄⣀⣀⣀⣀⣀⣀⣀⣀⣀⣀⣀⣀⣀⣀⣀⣀⣀⣀⣀⣀⡀│
|
||||||
|
└────────────────────────────────────────┘
|
||||||
|
4 8
|
||||||
|
sepal_length
|
||||||
20
test/fixtures/iris-scatter.txt
vendored
Normal file
20
test/fixtures/iris-scatter.txt
vendored
Normal file
@@ -0,0 +1,20 @@
|
|||||||
|
IRIS-SCATTER
|
||||||
|
┌────────────────────────────────────────┐
|
||||||
|
6.9 │⠀⠀⠀⠀⠀⠀⠀⠀⠀⠀⠀⠀⠀⠀⠀⠀⠀⠀⠀⠀⠀⠀⠀⠀⠀⠀⠀⠀⠀⠀⠀⠀⠀⠀⠀⠀⠄⠃⠀⠀│ sepal_width
|
||||||
|
│⠀⠀⠀⠀⠀⠀⠀⠀⠀⠀⠀⠀⠀⠀⠀⠀⠀⠀⠀⠀⠀⠀⠀⡀⠀⠀⠀⠀⠀⠀⠀⠀⡄⠂⠄⠀⠀⠄⠀⠁│ petal_length
|
||||||
|
│⠀⠀⠀⠀⠀⠀⠀⠀⠀⠀⠀⠀⠀⠀⠀⠀⠀⠀⠀⠀⢀⠀⠀⡀⡀⠂⠀⡆⠁⠄⠈⠀⠂⠀⠀⠀⠀⠀⠀⠀│ petal_width
|
||||||
|
│⠀⠀⠀⠀⠀⠀⠀⠀⠀⠀⠀⠀⠀⠀⠀⠀⠀⠀⡀⡀⡀⠀⠂⡀⠃⡅⠀⠄⠁⡂⠀⠀⠀⠀⠀⠀⠀⠀⠀⠀│ species
|
||||||
|
│⠀⠀⠀⠀⠀⠀⠀⠀⠀⠀⠀⠀⠀⠀⠀⠐⠀⠁⠀⠄⢕⠀⠄⡃⠀⠀⠀⡁⠄⠂⡀⠀⠀⠀⠀⠀⠀⠀⠀⠀│
|
||||||
|
│⠀⠀⠀⠀⠀⠀⠀⠀⠀⠁⠀⠀⠀⠀⠁⣊⠀⡃⠀⡀⠉⠀⠅⠂⠅⠙⠀⠂⠀⠀⠀⠀⠀⠀⠀⠀⠀⠀⠀⠀│
|
||||||
|
│⠀⠀⠀⠀⠀⠀⠀⠀⠀⠀⢠⠀⢅⠀⡄⡮⠀⠅⠇⠀⠒⠀⠀⠀⠀⠀⠀⠀⠀⠀⠀⠀⠀⠀⠀⠀⠀⠄⠀⠄│
|
||||||
|
│⠀⠀⠀⠀⠀⠨⠀⠠⠀⡀⣷⠀⠆⠀⠄⠊⠀⠂⠀⠀⠄⠀⠄⡄⠀⠀⠀⡀⠀⠀⠀⠀⠁⠀⠀⠀⠀⠀⠀⠀│
|
||||||
|
│⠀⠀⠐⠀⠇⠘⠀⠑⠀⠂⠓⠀⠀⠀⠂⢰⠀⡆⡀⠃⢶⠀⡄⡄⡇⡳⠀⠂⡃⠃⠑⠀⠃⠄⡀⠀⠂⡂⠀⠀│
|
||||||
|
│⠀⠀⠀⠀⠀⠀⠀⠀⠀⡄⠠⠀⠁⠀⠀⡮⠀⠆⡃⠀⠑⠀⠀⡅⠁⠀⠀⡄⠀⠀⠀⠀⠄⠀⠀⠀⠀⠂⠀⠀│
|
||||||
|
│⠀⠀⠀⠀⠀⠁⠀⢀⠀⠀⢅⠀⠀⠀⠀⠡⠀⠄⡀⠀⠁⠀⠁⡁⡃⠅⠀⠃⠃⠃⠐⠀⠀⠀⡀⠀⠂⠅⠀⠄│
|
||||||
|
│⠀⠀⠀⠀⡀⢠⠀⢤⠀⡆⣴⠀⡤⠀⠆⡠⠀⠆⠀⠅⢍⠀⠅⠅⠅⢅⠀⡇⡀⠄⡀⠀⠅⠁⠀⠀⠀⠀⠀⠀│
|
||||||
|
│⠀⠀⠠⠀⠁⢁⠀⠁⠀⡀⡣⠀⠀⠀⠁⡯⠀⡃⡂⠀⡘⠀⠁⠁⠁⠈⠀⠀⠀⠀⠀⠀⠀⠀⠀⠀⠀⠀⠀⠀│
|
||||||
|
│⠀⠀⠀⠀⠀⠀⠀⠀⠀⠀⢄⠀⠀⠀⠀⠀⠀⠀⠀⠀⠀⠀⠀⠀⠀⠀⠀⠀⠀⠀⠀⠀⠀⠀⠀⠀⠀⠀⠀⠀│
|
||||||
|
0 │⠀⠀⢀⠀⡄⣲⠀⣴⠀⡄⣿⠀⣤⠀⡅⣄⠀⡃⡄⡀⣀⠀⡀⡀⡀⣀⠀⡀⡀⡀⣀⠀⡀⡀⡀⠀⡀⡀⠀⡀│
|
||||||
|
└────────────────────────────────────────┘
|
||||||
|
4 8
|
||||||
|
sepal_length
|
||||||
@@ -3,6 +3,6 @@
|
|||||||
require 'simplecov'
|
require 'simplecov'
|
||||||
SimpleCov.start
|
SimpleCov.start
|
||||||
|
|
||||||
require 'uplot'
|
require 'youplot'
|
||||||
|
|
||||||
require 'test/unit'
|
require 'test/unit'
|
||||||
|
|||||||
@@ -1,6 +0,0 @@
|
|||||||
# frozen_string_literal: true
|
|
||||||
|
|
||||||
require_relative '../test_helper.rb'
|
|
||||||
|
|
||||||
class UplotCommandTest < Test::Unit::TestCase
|
|
||||||
end
|
|
||||||
@@ -1,6 +0,0 @@
|
|||||||
# frozen_string_literal: true
|
|
||||||
|
|
||||||
require_relative '../test_helper.rb'
|
|
||||||
|
|
||||||
class UplotPlotTest < Test::Unit::TestCase
|
|
||||||
end
|
|
||||||
@@ -1,9 +0,0 @@
|
|||||||
# frozen_string_literal: true
|
|
||||||
|
|
||||||
require 'test_helper'
|
|
||||||
|
|
||||||
class UplotTest < Test::Unit::TestCase
|
|
||||||
def test_that_it_has_a_version_number
|
|
||||||
assert_kind_of String, ::Uplot::VERSION
|
|
||||||
end
|
|
||||||
end
|
|
||||||
11
test/youplot/backends/processing_test.rb
Normal file
11
test/youplot/backends/processing_test.rb
Normal file
@@ -0,0 +1,11 @@
|
|||||||
|
# frozen_string_literal: true
|
||||||
|
|
||||||
|
require_relative '../../test_helper'
|
||||||
|
|
||||||
|
class YouPlotCommandTest < Test::Unit::TestCase
|
||||||
|
test :count_values do
|
||||||
|
@m = YouPlot::Backends::Processing
|
||||||
|
assert_equal([%i[a b c], [3, 2, 1]], @m.count_values(%i[a a a b b c]))
|
||||||
|
assert_equal([%i[c b a], [3, 2, 1]], @m.count_values(%i[a b b c c c]))
|
||||||
|
end
|
||||||
|
end
|
||||||
6
test/youplot/backends/unicode_plot_backend_test.rb
Normal file
6
test/youplot/backends/unicode_plot_backend_test.rb
Normal file
@@ -0,0 +1,6 @@
|
|||||||
|
# frozen_string_literal: true
|
||||||
|
|
||||||
|
require_relative '../../test_helper'
|
||||||
|
|
||||||
|
class YouPlotPlotTest < Test::Unit::TestCase
|
||||||
|
end
|
||||||
131
test/youplot/command_test.rb
Normal file
131
test/youplot/command_test.rb
Normal file
@@ -0,0 +1,131 @@
|
|||||||
|
# frozen_string_literal: true
|
||||||
|
|
||||||
|
require 'tempfile'
|
||||||
|
require_relative '../test_helper'
|
||||||
|
|
||||||
|
class YouPlotCommandTest < Test::Unit::TestCase
|
||||||
|
class << self
|
||||||
|
def startup
|
||||||
|
@stdin = $stdin.dup
|
||||||
|
@stdout = $stdout.dup
|
||||||
|
@stderr = $stderr.dup
|
||||||
|
end
|
||||||
|
|
||||||
|
def shutdown
|
||||||
|
$stdin = @stdin
|
||||||
|
$stdout = @stdout
|
||||||
|
$stderr = @stderr
|
||||||
|
end
|
||||||
|
end
|
||||||
|
|
||||||
|
def setup
|
||||||
|
$stdin = File.open(File.expand_path('../fixtures/iris.csv', __dir__), 'r')
|
||||||
|
@stderr_file = Tempfile.new
|
||||||
|
@stdout_file = Tempfile.new
|
||||||
|
$stderr = @stderr_file
|
||||||
|
$stdout = @stdout_file
|
||||||
|
end
|
||||||
|
|
||||||
|
def teardown
|
||||||
|
@stderr_file.close
|
||||||
|
end
|
||||||
|
|
||||||
|
def fixture(fname)
|
||||||
|
File.read(File.expand_path("../fixtures/#{fname}", __dir__))
|
||||||
|
end
|
||||||
|
|
||||||
|
test :bar do
|
||||||
|
YouPlot::Command.new(['bar', '-H', '-d,', '-t', 'IRIS-BARPLOT']).run
|
||||||
|
assert_equal fixture('iris-barplot.txt'), @stderr_file.read
|
||||||
|
end
|
||||||
|
|
||||||
|
test :barplot do
|
||||||
|
YouPlot::Command.new(['barplot', '-H', '-d,', '-t', 'IRIS-BARPLOT']).run
|
||||||
|
assert_equal fixture('iris-barplot.txt'), @stderr_file.read
|
||||||
|
end
|
||||||
|
|
||||||
|
test :hist do
|
||||||
|
YouPlot::Command.new(['hist', '-H', '-d,', '-t', 'IRIS-HISTOGRAM']).run
|
||||||
|
assert_equal fixture('iris-histogram.txt'), @stderr_file.read
|
||||||
|
end
|
||||||
|
|
||||||
|
test :histogram do
|
||||||
|
YouPlot::Command.new(['histogram', '-H', '-d,', '-t', 'IRIS-HISTOGRAM']).run
|
||||||
|
assert_equal fixture('iris-histogram.txt'), @stderr_file.read
|
||||||
|
end
|
||||||
|
|
||||||
|
test :line do
|
||||||
|
YouPlot::Command.new(['line', '-H', '-d,', '-t', 'IRIS-LINEPLOT']).run
|
||||||
|
assert_equal fixture('iris-lineplot.txt'), @stderr_file.read
|
||||||
|
end
|
||||||
|
|
||||||
|
test :lineplot do
|
||||||
|
YouPlot::Command.new(['lineplot', '-H', '-d,', '-t', 'IRIS-LINEPLOT']).run
|
||||||
|
assert_equal fixture('iris-lineplot.txt'), @stderr_file.read
|
||||||
|
end
|
||||||
|
|
||||||
|
test :lines do
|
||||||
|
YouPlot::Command.new(['lines', '-H', '-d,', '-t', 'IRIS-LINEPLOTS']).run
|
||||||
|
assert_equal fixture('iris-lineplots.txt'), @stderr_file.read
|
||||||
|
end
|
||||||
|
|
||||||
|
test :lineplots do
|
||||||
|
YouPlot::Command.new(['lineplots', '-H', '-d,', '-t', 'IRIS-LINEPLOTS']).run
|
||||||
|
assert_equal fixture('iris-lineplots.txt'), @stderr_file.read
|
||||||
|
end
|
||||||
|
|
||||||
|
test :s do
|
||||||
|
YouPlot::Command.new(['s', '-H', '-d,', '-t', 'IRIS-SCATTER']).run
|
||||||
|
assert_equal fixture('iris-scatter.txt'), @stderr_file.read
|
||||||
|
end
|
||||||
|
|
||||||
|
test :scatter do
|
||||||
|
YouPlot::Command.new(['scatter', '-H', '-d,', '-t', 'IRIS-SCATTER']).run
|
||||||
|
assert_equal fixture('iris-scatter.txt'), @stderr_file.read
|
||||||
|
end
|
||||||
|
|
||||||
|
test :d do
|
||||||
|
YouPlot::Command.new(['d', '-H', '-d,', '-t', 'IRIS-DENSITY']).run
|
||||||
|
assert_equal fixture('iris-density.txt'), @stderr_file.read
|
||||||
|
end
|
||||||
|
|
||||||
|
test :density do
|
||||||
|
YouPlot::Command.new(['density', '-H', '-d,', '-t', 'IRIS-DENSITY']).run
|
||||||
|
assert_equal fixture('iris-density.txt'), @stderr_file.read
|
||||||
|
end
|
||||||
|
|
||||||
|
test :box do
|
||||||
|
YouPlot::Command.new(['box', '-H', '-d,', '-t', 'IRIS-BOXPLOT']).run
|
||||||
|
assert_equal fixture('iris-boxplot.txt'), @stderr_file.read
|
||||||
|
end
|
||||||
|
|
||||||
|
test :boxplot do
|
||||||
|
YouPlot::Command.new(['boxplot', '-H', '-d,', '-t', 'IRIS-BOXPLOT']).run
|
||||||
|
assert_equal fixture('iris-boxplot.txt'), @stderr_file.read
|
||||||
|
end
|
||||||
|
|
||||||
|
test :plot_output_stdout do
|
||||||
|
YouPlot::Command.new(['bar', '-o', '-H', '-d,', '-t', 'IRIS-BARPLOT']).run
|
||||||
|
assert_equal '', @stderr_file.read
|
||||||
|
end
|
||||||
|
|
||||||
|
test :data_output_stdout do
|
||||||
|
YouPlot::Command.new(['bar', '-O', '-H', '-d,', '-t', 'IRIS-BARPLOT']).run
|
||||||
|
assert_equal fixture('iris-barplot.txt'), @stderr_file.read
|
||||||
|
assert_equal File.read(File.expand_path('../fixtures/iris.csv', __dir__)), @stdout_file.read
|
||||||
|
end
|
||||||
|
|
||||||
|
%i[colors color colours colour].each do |cmd_name|
|
||||||
|
test cmd_name do
|
||||||
|
YouPlot::Command.new([cmd_name.to_s]).run
|
||||||
|
assert_equal fixture('colors.txt'), @stderr_file.read
|
||||||
|
assert_equal '', @stdout_file.read
|
||||||
|
end
|
||||||
|
end
|
||||||
|
|
||||||
|
test :colors_output_stdout do
|
||||||
|
YouPlot::Command.new(['colors', '-o']).run
|
||||||
|
assert_equal '', @stderr_file.read
|
||||||
|
assert_equal fixture('colors.txt'), @stdout_file.read
|
||||||
|
end
|
||||||
|
end
|
||||||
@@ -1,10 +1,10 @@
|
|||||||
# frozen_string_literal: true
|
# frozen_string_literal: true
|
||||||
|
|
||||||
require_relative '../test_helper.rb'
|
require_relative '../test_helper'
|
||||||
|
|
||||||
class UplotPreprocessingTest < Test::Unit::TestCase
|
class YouPlotDSVReaderTest < Test::Unit::TestCase
|
||||||
def setup
|
def setup
|
||||||
@m = Uplot::Preprocessing
|
@m = YouPlot::DSVReader
|
||||||
end
|
end
|
||||||
|
|
||||||
test :transpose2 do
|
test :transpose2 do
|
||||||
@@ -124,9 +124,4 @@ class UplotPreprocessingTest < Test::Unit::TestCase
|
|||||||
[2, 4],
|
[2, 4],
|
||||||
[3, 5, 6]], false, false))
|
[3, 5, 6]], false, false))
|
||||||
end
|
end
|
||||||
|
|
||||||
test :count do
|
|
||||||
assert_equal([%i[a b c], [3, 2, 1]], @m.count(%i[a a a b b c]))
|
|
||||||
assert_equal([%i[c b a], [3, 2, 1]], @m.count(%i[a b b c c c]))
|
|
||||||
end
|
|
||||||
end
|
end
|
||||||
9
test/youplot_test.rb
Normal file
9
test/youplot_test.rb
Normal file
@@ -0,0 +1,9 @@
|
|||||||
|
# frozen_string_literal: true
|
||||||
|
|
||||||
|
require_relative 'test_helper'
|
||||||
|
|
||||||
|
class YouPlotTest < Test::Unit::TestCase
|
||||||
|
def test_that_it_has_a_version_number
|
||||||
|
assert_kind_of String, ::YouPlot::VERSION
|
||||||
|
end
|
||||||
|
end
|
||||||
@@ -1,10 +1,10 @@
|
|||||||
# frozen_string_literal: true
|
# frozen_string_literal: true
|
||||||
|
|
||||||
require_relative 'lib/uplot/version'
|
require_relative 'lib/youplot/version'
|
||||||
|
|
||||||
Gem::Specification.new do |spec|
|
Gem::Specification.new do |spec|
|
||||||
spec.name = 'u-plot'
|
spec.name = 'youplot'
|
||||||
spec.version = Uplot::VERSION
|
spec.version = YouPlot::VERSION
|
||||||
spec.authors = ['kojix2']
|
spec.authors = ['kojix2']
|
||||||
spec.email = ['2xijok@gmail.com']
|
spec.email = ['2xijok@gmail.com']
|
||||||
|
|
||||||
@@ -13,13 +13,13 @@ Gem::Specification.new do |spec|
|
|||||||
Create ASCII charts on the terminal with data from standard streams in the
|
Create ASCII charts on the terminal with data from standard streams in the
|
||||||
pipeline.
|
pipeline.
|
||||||
MSG
|
MSG
|
||||||
spec.homepage = 'https://github.com/kojix2/uplot'
|
spec.homepage = 'https://github.com/kojix2/youplot'
|
||||||
spec.license = 'MIT'
|
spec.license = 'MIT'
|
||||||
spec.required_ruby_version = Gem::Requirement.new('>= 2.3.0')
|
spec.required_ruby_version = Gem::Requirement.new('>= 2.4.0')
|
||||||
|
|
||||||
spec.files = Dir['*.{md,txt}', '{lib,exe}/**/*']
|
spec.files = Dir['*.{md,txt}', '{lib,exe}/**/*']
|
||||||
spec.bindir = 'exe'
|
spec.bindir = 'exe'
|
||||||
spec.executables = ['uplot']
|
spec.executables = ['uplot', 'youplot']
|
||||||
spec.require_paths = ['lib']
|
spec.require_paths = ['lib']
|
||||||
|
|
||||||
spec.add_runtime_dependency 'unicode_plot'
|
spec.add_runtime_dependency 'unicode_plot'
|
||||||
Reference in New Issue
Block a user