mirror of
https://github.com/red-data-tools/YouPlot.git
synced 2025-09-19 02:18:08 +08:00
Compare commits
20 Commits
| Author | SHA1 | Date | |
|---|---|---|---|
|
|
7edbe6f41b | ||
|
|
61168a6223 | ||
|
|
00b8aee572 | ||
|
|
e760ae504b | ||
|
|
fae4248d1f | ||
|
|
73b7693915 | ||
|
|
7f3e430cc9 | ||
|
|
1b525f1335 | ||
|
|
6d707533a0 | ||
|
|
60fb611160 | ||
|
|
f0861bcac4 | ||
|
|
1669024325 | ||
|
|
9a7f066f3b | ||
|
|
f0c5e631f7 | ||
|
|
fd7b755c79 | ||
|
|
d6e1840e58 | ||
|
|
59b81606f5 | ||
|
|
b5a88e10a2 | ||
|
|
6335386762 | ||
|
|
887b9d3c53 |
4
.github/workflows/ci.yml
vendored
4
.github/workflows/ci.yml
vendored
@@ -7,10 +7,10 @@ jobs:
|
||||
strategy:
|
||||
matrix:
|
||||
os: ['ubuntu', 'macos']
|
||||
ruby: [ '2.5', '2.6', '2.7' ]
|
||||
ruby: [ '2.5', '2.6', '2.7', '3.0' ]
|
||||
steps:
|
||||
- uses: actions/checkout@v2
|
||||
- uses: actions/setup-ruby@v1
|
||||
- uses: ruby/setup-ruby@v1
|
||||
with:
|
||||
ruby-version: ${{ matrix.ruby }}
|
||||
- run: gem install bundler
|
||||
|
||||
75
README.md
75
README.md
@@ -1,4 +1,6 @@
|
||||

|
||||
<p align="center">
|
||||
<img src="https://user-images.githubusercontent.com/5798442/103439598-9e952a00-4c81-11eb-881f-67c593bb7861.png" width="75%" height="75%" />
|
||||
</p>
|
||||
|
||||

|
||||
[](https://badge.fury.io/rb/youplot)
|
||||
@@ -18,7 +20,8 @@ gem install youplot
|
||||
|
||||
## Quick Start
|
||||
|
||||
`cat data.tsv | uplot <command> [options]`
|
||||
* `cat data.tsv | uplot <command> [options]` or
|
||||
* `uplot <command> [options] <data.tsv>`
|
||||
|
||||
### barplot
|
||||
|
||||
@@ -29,7 +32,9 @@ curl -sL https://git.io/ISLANDScsv \
|
||||
| uplot bar -d, -t "Areas of the World's Major Landmasses"
|
||||
```
|
||||
|
||||

|
||||
<p align="center">
|
||||
<img alt="barplot" src="https://user-images.githubusercontent.com/5798442/101999903-d36a2d00-3d24-11eb-9361-b89116f44122.png">
|
||||
</p>
|
||||
|
||||
### histogram
|
||||
|
||||
@@ -40,7 +45,10 @@ echo -e "from numpy import random;" \
|
||||
| python \
|
||||
| uplot hist --nbins 20
|
||||
```
|
||||

|
||||
|
||||
<p align="center">
|
||||
<img alt="histogram" src="https://user-images.githubusercontent.com/5798442/101999820-21cafc00-3d24-11eb-86db-e410d19b07df.png">
|
||||
</p>
|
||||
|
||||
### lineplot
|
||||
|
||||
@@ -50,7 +58,9 @@ curl -sL https://git.io/AirPassengers \
|
||||
| uplot line -d, -w 50 -h 15 -t AirPassengers --xlim 1950,1960 --ylim 0,600
|
||||
```
|
||||
|
||||

|
||||
<p align="center">
|
||||
<img alt="lineplot" src="https://user-images.githubusercontent.com/5798442/101999825-24c5ec80-3d24-11eb-99f4-c642e8d221bc.png">
|
||||
</p>
|
||||
|
||||
### scatter
|
||||
|
||||
@@ -60,7 +70,9 @@ curl -sL https://git.io/IRIStsv \
|
||||
| uplot scatter -H -t IRIS
|
||||
```
|
||||
|
||||

|
||||
<p align="center">
|
||||
<img alt="scatter" src="https://user-images.githubusercontent.com/5798442/101999827-27284680-3d24-11eb-9903-551857eaa69c.png">
|
||||
</p>
|
||||
|
||||
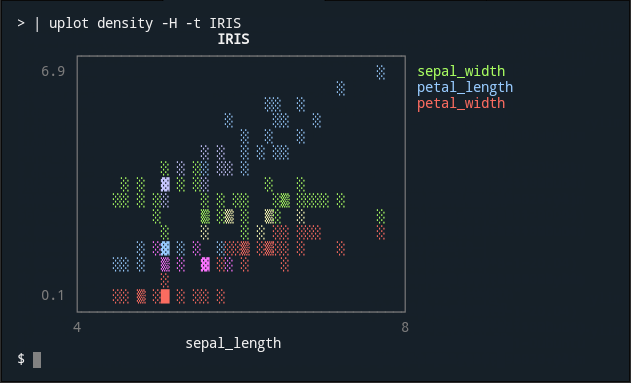
### density
|
||||
|
||||
@@ -70,7 +82,9 @@ curl -sL https://git.io/IRIStsv \
|
||||
| uplot density -H -t IRIS
|
||||
```
|
||||
|
||||
|
||||
<p align="center">
|
||||
<img alt="density" src="https://user-images.githubusercontent.com/5798442/101999828-2abbcd80-3d24-11eb-902c-2f44266fa6ae.png">
|
||||
</p>
|
||||
|
||||
### boxplot
|
||||
|
||||
@@ -80,11 +94,13 @@ curl -sL https://git.io/IRIStsv \
|
||||
| uplot boxplot -H -t IRIS
|
||||
```
|
||||
|
||||

|
||||
<p align="center">
|
||||
<img alt="boxplot" src="https://user-images.githubusercontent.com/5798442/101999830-2e4f5480-3d24-11eb-8891-728c18bf5b35.png">
|
||||
</p>
|
||||
|
||||
### count
|
||||
|
||||
In this example, YouPlot counts the number of chromosomes where the gene is located from the human gene annotation file and create a bar chart. The human gene annotation file can be downloaded from the following website.
|
||||
In this example, YouPlot counts the number of chromosomes where the gene is located from the human gene annotation file and it creates a bar chart. The human gene annotation file can be downloaded from the following website.
|
||||
|
||||
* https://www.gencodegenes.org/human/
|
||||
|
||||
@@ -94,10 +110,12 @@ cat gencode.v35.annotation.gff3 \
|
||||
uplot count -t "The number of human gene annotations per chromosome" -c blue
|
||||
```
|
||||
|
||||

|
||||
<p align="center">
|
||||
<img alt="count" src="https://user-images.githubusercontent.com/5798442/101999832-30b1ae80-3d24-11eb-96fe-e5000bed1f5c.png">
|
||||
</p>
|
||||
|
||||
Note: `count` is not very fast because it runs in a Ruby script.
|
||||
This is fine if the data is small, that is, in most cases. However, if you want to visualize huge data, it is faster to use a combination of common Unix commands as shown below.
|
||||
This is fine in most cases, as long as the data size is small. If you want to visualize huge data, it is faster to use a combination of common Unix commands as shown below.
|
||||
|
||||
```sh
|
||||
cat gencode.v35.annotation.gff3 | grep -v '#' | grep 'gene' | cut -f1 \
|
||||
@@ -109,8 +127,8 @@ cat gencode.v35.annotation.gff3 | grep -v '#' | grep 'gene' | cut -f1 \
|
||||
|
||||
### Why YouPlot?
|
||||
|
||||
Wouldn't it be a bit of pain to have to run R, Python, Julia, gnuplot or whatever REPL just to check your data?
|
||||
YouPlot is a command line tool for this purpose. With YouPlot, you can continue working without leaving your terminal and shell.
|
||||
Wouldn't it be a pain to have to run R, Python, Julia, gnuplot or whatever REPL just to check your data?
|
||||
YouPlot is a command line tool for this purpose. With YouPlot, you can continue working without leaving your terminal and shell.
|
||||
|
||||
### how to use YouPlot?
|
||||
|
||||
@@ -124,17 +142,17 @@ YouPlot is a command line tool for this purpose. With YouPlot, you can continue
|
||||
|
||||
### Where to output the plot?
|
||||
|
||||
By default, the plot is output to *standard error output*.
|
||||
By default, the plot is output to *standard error output*.
|
||||
The output file or stream for the plot can be specified with the `-o` option.
|
||||
|
||||
### Where to output the input data?
|
||||
|
||||
By default, the input data is not output anywhere.
|
||||
By default, the input data is not shown anywhere.
|
||||
The `-O` option, with no arguments, outputs the input data directly to the standard output. This is useful when passing data to a subsequent pipeline.
|
||||
|
||||
### What types of plots are available?
|
||||
|
||||
The following sub-commands are available
|
||||
The following sub-commands are available.
|
||||
|
||||
| command | short | how it works |
|
||||
|-----------|-------|----------------------------------------|
|
||||
@@ -150,9 +168,29 @@ See Quick Start for `count`.
|
||||
|
||||
| command | short | how it works |
|
||||
|-----------|-------|----------------------------------------------------------|
|
||||
| count | c | draw a baplot based on the number of occurrences (slow) |
|
||||
| count | c | draw a barplot based on the number of occurrences (slow) |
|
||||
|
||||
### How to view detailed command line options
|
||||
### What if the header line is included?
|
||||
|
||||
If your input data contains a header line, you need to specify the `-H` option.
|
||||
|
||||
### How to specify the delimiter?
|
||||
|
||||
Use the `-d` option. To specify a blank space, you can use `uplot bar -d ' ' data.txt`. You do not need to use `-d` option for tab-delimited text since the default value is tab.
|
||||
|
||||
### Is there a way to specify a column as the x-axis or y-axis?
|
||||
|
||||
Not yet. In principle, YouPlot treats the first column as the X axis and the second column as the Y axis. When working with multiple series, the first row is the X axis, the second row is series 1, the third row is series 2, and so on. If you pass only one column of data for `line` and `bar`, YouPlot will automatically use a sequential number starting from 1 as the X-axis. The `--fmt xyy`, `--fmt xyxy` and `--fmt yx` options give you a few more choices. See `youplot <command> --help` for more details. YouPlot has limited functionalities, but you can use shell scripts such as `awk '{print $2, $1}'` to swap lines.
|
||||
|
||||
### How to plot real-time data?
|
||||
|
||||
Experimental progressive mode is currently under development.
|
||||
|
||||
```sh
|
||||
ruby -e 'loop{puts rand(100)}' | uplot line --progress
|
||||
```
|
||||
|
||||
### How to view detailed command line options?
|
||||
|
||||
Use `--help` to print command-specific options.
|
||||
|
||||
@@ -181,6 +219,7 @@ uplot colors
|
||||
* [Report bugs](https://github.com/kojix2/youplot/issues)
|
||||
* Fix bugs and [submit pull requests](https://github.com/kojix2/youplot/pulls)
|
||||
* Write, clarify, or fix documentation
|
||||
* English corrections by native speakers are welcome.
|
||||
* Suggest or add new features
|
||||
|
||||
|
||||
|
||||
@@ -2,7 +2,7 @@
|
||||
|
||||
require 'unicode_plot'
|
||||
require 'youplot/version'
|
||||
require 'youplot/dsv_reader'
|
||||
require 'youplot/dsv'
|
||||
require 'youplot/command'
|
||||
|
||||
module YouPlot
|
||||
|
||||
@@ -1,6 +1,6 @@
|
||||
# frozen_string_literal: true
|
||||
|
||||
require_relative 'dsv_reader'
|
||||
require_relative 'dsv'
|
||||
require_relative 'command/parser'
|
||||
|
||||
# FIXME
|
||||
@@ -31,6 +31,14 @@ module YouPlot
|
||||
if %i[colors color colours colour].include? @command
|
||||
plot = create_plot
|
||||
output_plot(plot)
|
||||
elsif options[:progressive]
|
||||
stop = false
|
||||
Signal.trap(:INT) { stop = true }
|
||||
while (input = Kernel.gets)
|
||||
main_progressive(input)
|
||||
break if stop
|
||||
end
|
||||
options[:output].print "\e[0J"
|
||||
else
|
||||
# Sometimes the input file does not end with a newline code.
|
||||
while (input = Kernel.gets(nil))
|
||||
@@ -52,9 +60,31 @@ module YouPlot
|
||||
output_plot(plot)
|
||||
end
|
||||
|
||||
def main_progressive(input)
|
||||
output_data(input)
|
||||
|
||||
# FIXME
|
||||
# Worked around the problem of not being able to draw
|
||||
# plots when there is only one header line.
|
||||
if @raw_data.nil?
|
||||
@raw_data = String.new
|
||||
if options[:headers]
|
||||
@raw_data << input
|
||||
return
|
||||
end
|
||||
end
|
||||
@raw_data << input
|
||||
|
||||
# FIXME
|
||||
@data = read_dsv(@raw_data)
|
||||
|
||||
plot = create_plot
|
||||
output_plot_progressive(plot)
|
||||
end
|
||||
|
||||
def read_dsv(input)
|
||||
input = input.dup.force_encoding(options[:encoding]).encode('utf-8') if options[:encoding]
|
||||
DSVReader.input(input, options[:delimiter], options[:headers], options[:transpose])
|
||||
DSV.parse(input, options[:delimiter], options[:headers], options[:transpose])
|
||||
end
|
||||
|
||||
def create_plot
|
||||
@@ -106,5 +136,29 @@ module YouPlot
|
||||
end
|
||||
end
|
||||
end
|
||||
|
||||
def output_plot_progressive(plot)
|
||||
case options[:output]
|
||||
when IO
|
||||
# RefactorMe
|
||||
out = StringIO.new(String.new)
|
||||
def out.tty?
|
||||
true
|
||||
end
|
||||
plot.render(out)
|
||||
lines = out.string.lines
|
||||
lines.each do |line|
|
||||
options[:output].print line.chomp
|
||||
options[:output].print "\e[0K"
|
||||
options[:output].puts
|
||||
end
|
||||
options[:output].print "\e[0J"
|
||||
options[:output].flush
|
||||
n = out.string.lines.size
|
||||
options[:output].print "\e[#{n}F"
|
||||
else
|
||||
raise 'In progressive mode, output to a file is not possible.'
|
||||
end
|
||||
end
|
||||
end
|
||||
end
|
||||
|
||||
@@ -2,11 +2,12 @@
|
||||
|
||||
module YouPlot
|
||||
class Command
|
||||
CmdOptions = Struct.new(
|
||||
Options = Struct.new(
|
||||
:delimiter,
|
||||
:transpose,
|
||||
:headers,
|
||||
:pass,
|
||||
:progressive,
|
||||
:output,
|
||||
:fmt,
|
||||
:encoding,
|
||||
@@ -1,7 +1,7 @@
|
||||
# frozen_string_literal: true
|
||||
|
||||
require 'optparse'
|
||||
require_relative 'cmd_options'
|
||||
require_relative 'options'
|
||||
require_relative 'plot_params'
|
||||
|
||||
module YouPlot
|
||||
@@ -12,7 +12,7 @@ module YouPlot
|
||||
def initialize
|
||||
@command = nil
|
||||
|
||||
@options = CmdOptions.new(
|
||||
@options = Options.new(
|
||||
delimiter: "\t",
|
||||
transpose: false,
|
||||
headers: nil,
|
||||
@@ -82,7 +82,7 @@ module YouPlot
|
||||
opt.on('--[no-]labels', TrueClass, 'hide the labels') do |v|
|
||||
params.labels = v
|
||||
end
|
||||
opt.on('--progress', TrueClass, 'progressive') do |v|
|
||||
opt.on('--progress', TrueClass, 'progressive mode [experimental]') do |v|
|
||||
@options[:progressive] = v
|
||||
end
|
||||
opt.on('--encoding VAL', String, 'Specify the input encoding') do |v|
|
||||
|
||||
@@ -4,10 +4,10 @@ require 'csv'
|
||||
|
||||
module YouPlot
|
||||
# Read and interpret Delimiter-separated values format file or stream.
|
||||
module DSVReader
|
||||
module DSV
|
||||
module_function
|
||||
|
||||
def input(input, delimiter, headers, transpose)
|
||||
def parse(input, delimiter, headers, transpose)
|
||||
arr = parse_as_csv(input, delimiter)
|
||||
headers = get_headers(arr, headers, transpose)
|
||||
series = get_series(arr, headers, transpose)
|
||||
@@ -57,16 +57,22 @@ module YouPlot
|
||||
end
|
||||
|
||||
def get_series(arr, headers, transpose)
|
||||
if transpose
|
||||
if headers
|
||||
arr.map { |row| row[1..-1] }
|
||||
if headers
|
||||
if arr.size > 1
|
||||
if transpose
|
||||
arr.map { |row| row[1..-1] }
|
||||
else
|
||||
transpose2(arr[1..-1])
|
||||
end
|
||||
else
|
||||
arr
|
||||
Array.new(arr[0].size, [])
|
||||
end
|
||||
elsif headers
|
||||
transpose2(arr[1..-1])
|
||||
else
|
||||
transpose2(arr)
|
||||
if transpose
|
||||
arr
|
||||
else
|
||||
transpose2(arr)
|
||||
end
|
||||
end
|
||||
end
|
||||
end
|
||||
@@ -1,5 +1,5 @@
|
||||
# frozen_string_literal: true
|
||||
|
||||
module YouPlot
|
||||
VERSION = '0.3.2'
|
||||
VERSION = '0.3.3'
|
||||
end
|
||||
|
||||
@@ -2,9 +2,9 @@
|
||||
|
||||
require_relative '../test_helper'
|
||||
|
||||
class YouPlotDSVReaderTest < Test::Unit::TestCase
|
||||
class YouPlotDSVTest < Test::Unit::TestCase
|
||||
def setup
|
||||
@m = YouPlot::DSVReader
|
||||
@m = YouPlot::DSV
|
||||
end
|
||||
|
||||
test :transpose2 do
|
||||
@@ -59,6 +59,8 @@ class YouPlotDSVReaderTest < Test::Unit::TestCase
|
||||
assert_equal(nil, @m.get_headers([[1, 2, 3],
|
||||
[4, 5, 6],
|
||||
[7, 8, 9]], false, false))
|
||||
|
||||
assert_equal([1, 2, 3], @m.get_headers([[1, 2, 3]], true, false))
|
||||
end
|
||||
|
||||
test :get_series do
|
||||
@@ -123,5 +125,7 @@ class YouPlotDSVReaderTest < Test::Unit::TestCase
|
||||
[n, n, 6]], @m.get_series([[1],
|
||||
[2, 4],
|
||||
[3, 5, 6]], false, false))
|
||||
|
||||
assert_equal([[], [] ,[]], @m.get_series([[1, 2, 3]], true, false))
|
||||
end
|
||||
end
|
||||
@@ -8,11 +8,8 @@ Gem::Specification.new do |spec|
|
||||
spec.authors = ['kojix2']
|
||||
spec.email = ['2xijok@gmail.com']
|
||||
|
||||
spec.summary = 'Create Ascii charts on your terminal.'
|
||||
spec.description = <<~MSG
|
||||
Create ASCII charts on the terminal with data from standard streams in the
|
||||
pipeline.
|
||||
MSG
|
||||
spec.summary = 'A command line tool for Unicode Plotting'
|
||||
spec.description = 'A command line tool for Unicode Plotting'
|
||||
spec.homepage = 'https://github.com/kojix2/youplot'
|
||||
spec.license = 'MIT'
|
||||
spec.required_ruby_version = Gem::Requirement.new('>= 2.4.0')
|
||||
|
||||
Reference in New Issue
Block a user