mirror of
https://github.com/red-data-tools/YouPlot.git
synced 2025-09-19 10:28:06 +08:00
Compare commits
52 Commits
| Author | SHA1 | Date | |
|---|---|---|---|
|
|
e3374c825e | ||
|
|
c8bdafe9a2 | ||
|
|
161c85045f | ||
|
|
3121c43b14 | ||
|
|
c4e6c7ac8c | ||
|
|
edf8849d6a | ||
|
|
2e4666f9b4 | ||
|
|
3bbcea165f | ||
|
|
3b34ca0e27 | ||
|
|
abba3e1678 | ||
|
|
991cf90267 | ||
|
|
8db1306e07 | ||
|
|
62cc6ba364 | ||
|
|
10e096d7c9 | ||
|
|
fbfcf80d25 | ||
|
|
8c4011d368 | ||
|
|
ea4c2a5c70 | ||
|
|
c74d54623d | ||
|
|
b8e7f5af88 | ||
|
|
a8ce96888e | ||
|
|
c9513e463f | ||
|
|
b2f2c16c59 | ||
|
|
93195713e6 | ||
|
|
2e7a7c8851 | ||
|
|
8d6d9158f2 | ||
|
|
774fa88872 | ||
|
|
001434a507 | ||
|
|
08b946fb7e | ||
|
|
9fcb647aa5 | ||
|
|
68101d31cb | ||
|
|
dbbff1dc3a | ||
|
|
e8923dc876 | ||
|
|
7edbe6f41b | ||
|
|
61168a6223 | ||
|
|
00b8aee572 | ||
|
|
e760ae504b | ||
|
|
fae4248d1f | ||
|
|
73b7693915 | ||
|
|
7f3e430cc9 | ||
|
|
1b525f1335 | ||
|
|
6d707533a0 | ||
|
|
60fb611160 | ||
|
|
f0861bcac4 | ||
|
|
1669024325 | ||
|
|
9a7f066f3b | ||
|
|
f0c5e631f7 | ||
|
|
fd7b755c79 | ||
|
|
d6e1840e58 | ||
|
|
59b81606f5 | ||
|
|
b5a88e10a2 | ||
|
|
6335386762 | ||
|
|
887b9d3c53 |
4
.github/workflows/ci.yml
vendored
4
.github/workflows/ci.yml
vendored
@@ -7,10 +7,10 @@ jobs:
|
||||
strategy:
|
||||
matrix:
|
||||
os: ['ubuntu', 'macos']
|
||||
ruby: [ '2.5', '2.6', '2.7' ]
|
||||
ruby: [ '2.5', '2.6', '2.7', '3.0' ]
|
||||
steps:
|
||||
- uses: actions/checkout@v2
|
||||
- uses: actions/setup-ruby@v1
|
||||
- uses: ruby/setup-ruby@v1
|
||||
with:
|
||||
ruby-version: ${{ matrix.ruby }}
|
||||
- run: gem install bundler
|
||||
|
||||
79
README.md
79
README.md
@@ -1,4 +1,6 @@
|
||||

|
||||
<p align="center">
|
||||
<img src="https://user-images.githubusercontent.com/5798442/103439598-9e952a00-4c81-11eb-881f-67c593bb7861.png" width="75%" height="75%" />
|
||||
</p>
|
||||
|
||||

|
||||
[](https://badge.fury.io/rb/youplot)
|
||||
@@ -18,7 +20,8 @@ gem install youplot
|
||||
|
||||
## Quick Start
|
||||
|
||||
`cat data.tsv | uplot <command> [options]`
|
||||
* `cat data.tsv | uplot <command> [options]` or
|
||||
* `uplot <command> [options] <data.tsv>`
|
||||
|
||||
### barplot
|
||||
|
||||
@@ -29,7 +32,9 @@ curl -sL https://git.io/ISLANDScsv \
|
||||
| uplot bar -d, -t "Areas of the World's Major Landmasses"
|
||||
```
|
||||
|
||||

|
||||
<p align="center">
|
||||
<img alt="barplot" src="https://user-images.githubusercontent.com/5798442/101999903-d36a2d00-3d24-11eb-9361-b89116f44122.png">
|
||||
</p>
|
||||
|
||||
### histogram
|
||||
|
||||
@@ -40,7 +45,10 @@ echo -e "from numpy import random;" \
|
||||
| python \
|
||||
| uplot hist --nbins 20
|
||||
```
|
||||

|
||||
|
||||
<p align="center">
|
||||
<img alt="histogram" src="https://user-images.githubusercontent.com/5798442/101999820-21cafc00-3d24-11eb-86db-e410d19b07df.png">
|
||||
</p>
|
||||
|
||||
### lineplot
|
||||
|
||||
@@ -50,7 +58,9 @@ curl -sL https://git.io/AirPassengers \
|
||||
| uplot line -d, -w 50 -h 15 -t AirPassengers --xlim 1950,1960 --ylim 0,600
|
||||
```
|
||||
|
||||

|
||||
<p align="center">
|
||||
<img alt="lineplot" src="https://user-images.githubusercontent.com/5798442/101999825-24c5ec80-3d24-11eb-99f4-c642e8d221bc.png">
|
||||
</p>
|
||||
|
||||
### scatter
|
||||
|
||||
@@ -60,7 +70,9 @@ curl -sL https://git.io/IRIStsv \
|
||||
| uplot scatter -H -t IRIS
|
||||
```
|
||||
|
||||

|
||||
<p align="center">
|
||||
<img alt="scatter" src="https://user-images.githubusercontent.com/5798442/101999827-27284680-3d24-11eb-9903-551857eaa69c.png">
|
||||
</p>
|
||||
|
||||
### density
|
||||
|
||||
@@ -70,7 +82,9 @@ curl -sL https://git.io/IRIStsv \
|
||||
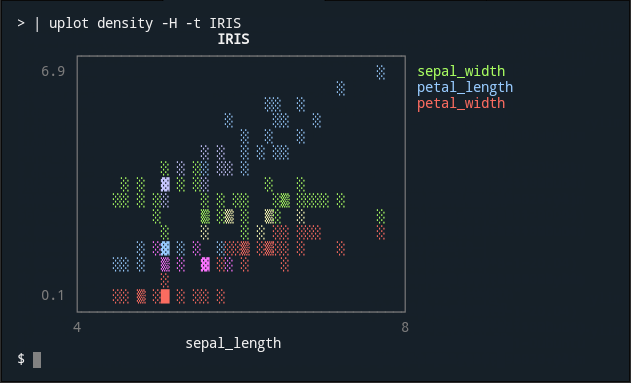
| uplot density -H -t IRIS
|
||||
```
|
||||
|
||||
|
||||
<p align="center">
|
||||
<img alt="density" src="https://user-images.githubusercontent.com/5798442/101999828-2abbcd80-3d24-11eb-902c-2f44266fa6ae.png">
|
||||
</p>
|
||||
|
||||
### boxplot
|
||||
|
||||
@@ -80,11 +94,13 @@ curl -sL https://git.io/IRIStsv \
|
||||
| uplot boxplot -H -t IRIS
|
||||
```
|
||||
|
||||

|
||||
<p align="center">
|
||||
<img alt="boxplot" src="https://user-images.githubusercontent.com/5798442/101999830-2e4f5480-3d24-11eb-8891-728c18bf5b35.png">
|
||||
</p>
|
||||
|
||||
### count
|
||||
|
||||
In this example, YouPlot counts the number of chromosomes where the gene is located from the human gene annotation file and create a bar chart. The human gene annotation file can be downloaded from the following website.
|
||||
In this example, YouPlot counts the number of chromosomes where the gene is located from the human gene annotation file and it creates a bar chart. The human gene annotation file can be downloaded from the following website.
|
||||
|
||||
* https://www.gencodegenes.org/human/
|
||||
|
||||
@@ -94,10 +110,12 @@ cat gencode.v35.annotation.gff3 \
|
||||
uplot count -t "The number of human gene annotations per chromosome" -c blue
|
||||
```
|
||||
|
||||

|
||||
<p align="center">
|
||||
<img alt="count" src="https://user-images.githubusercontent.com/5798442/101999832-30b1ae80-3d24-11eb-96fe-e5000bed1f5c.png">
|
||||
</p>
|
||||
|
||||
Note: `count` is not very fast because it runs in a Ruby script.
|
||||
This is fine if the data is small, that is, in most cases. However, if you want to visualize huge data, it is faster to use a combination of common Unix commands as shown below.
|
||||
This is fine in most cases, as long as the data size is small. If you want to visualize huge data, it is faster to use a combination of common Unix commands as shown below.
|
||||
|
||||
```sh
|
||||
cat gencode.v35.annotation.gff3 | grep -v '#' | grep 'gene' | cut -f1 \
|
||||
@@ -109,7 +127,7 @@ cat gencode.v35.annotation.gff3 | grep -v '#' | grep 'gene' | cut -f1 \
|
||||
|
||||
### Why YouPlot?
|
||||
|
||||
Wouldn't it be a bit of pain to have to run R, Python, Julia, gnuplot or whatever REPL just to check your data?
|
||||
Wouldn't it be a pain to have to run R, Python, Julia, gnuplot or whatever REPL just to check your data?
|
||||
YouPlot is a command line tool for this purpose. With YouPlot, you can continue working without leaving your terminal and shell.
|
||||
|
||||
### how to use YouPlot?
|
||||
@@ -129,12 +147,12 @@ The output file or stream for the plot can be specified with the `-o` option.
|
||||
|
||||
### Where to output the input data?
|
||||
|
||||
By default, the input data is not output anywhere.
|
||||
By default, the input data is not shown anywhere.
|
||||
The `-O` option, with no arguments, outputs the input data directly to the standard output. This is useful when passing data to a subsequent pipeline.
|
||||
|
||||
### What types of plots are available?
|
||||
|
||||
The following sub-commands are available
|
||||
The following sub-commands are available.
|
||||
|
||||
| command | short | how it works |
|
||||
|-----------|-------|----------------------------------------|
|
||||
@@ -150,9 +168,29 @@ See Quick Start for `count`.
|
||||
|
||||
| command | short | how it works |
|
||||
|-----------|-------|----------------------------------------------------------|
|
||||
| count | c | draw a baplot based on the number of occurrences (slow) |
|
||||
| count | c | draw a barplot based on the number of occurrences (slow) |
|
||||
|
||||
### How to view detailed command line options
|
||||
### What if the header line is included?
|
||||
|
||||
If your input data contains a header line, you need to specify the `-H` option.
|
||||
|
||||
### How to specify the delimiter?
|
||||
|
||||
Use the `-d` option. To specify a blank space, you can use `uplot bar -d ' ' data.txt`. You do not need to use `-d` option for tab-delimited text since the default value is tab.
|
||||
|
||||
### Is there a way to specify a column as the x-axis or y-axis?
|
||||
|
||||
Not yet. In principle, YouPlot treats the first column as the X axis and the second column as the Y axis. When working with multiple series, the first row is the X axis, the second row is series 1, the third row is series 2, and so on. If you pass only one column of data for `line` and `bar`, YouPlot will automatically use a sequential number starting from 1 as the X-axis. The `--fmt xyy`, `--fmt xyxy` and `--fmt yx` options give you a few more choices. See `youplot <command> --help` for more details. YouPlot has limited functionalities, but you can use shell scripts such as `awk '{print $2, $1}'` to swap lines.
|
||||
|
||||
### How to plot real-time data?
|
||||
|
||||
Experimental progressive mode is currently under development.
|
||||
|
||||
```sh
|
||||
ruby -e 'loop{puts rand(100)}' | uplot line --progress
|
||||
```
|
||||
|
||||
### How to view detailed command line options?
|
||||
|
||||
Use `--help` to print command-specific options.
|
||||
|
||||
@@ -163,7 +201,7 @@ Usage: uplot histogram [options] <in.tsv>
|
||||
|
||||
Options for histogram:
|
||||
--symbol VAL character to be used to plot the bars
|
||||
--closed VAL
|
||||
--closed VAL side of the intervals to be closed [left]
|
||||
-n, --nbins VAL approximate number of bins
|
||||
|
||||
Options:
|
||||
@@ -181,6 +219,7 @@ uplot colors
|
||||
* [Report bugs](https://github.com/kojix2/youplot/issues)
|
||||
* Fix bugs and [submit pull requests](https://github.com/kojix2/youplot/pulls)
|
||||
* Write, clarify, or fix documentation
|
||||
* English corrections by native speakers are welcome.
|
||||
* Suggest or add new features
|
||||
|
||||
|
||||
@@ -194,6 +233,12 @@ bundle exec rake test # Run the test
|
||||
bundle exec rake install # Installation from source code
|
||||
```
|
||||
|
||||
### Acknowledgements
|
||||
|
||||
* [Red Data Tools](https://github.com/red-data-tools) - Technical support
|
||||
* [sampo grafiikka](https://jypg.net/sampo_grafiikka) - Project logo creation
|
||||
* [yutaas](https://github.com/yutaas) - English proofreading
|
||||
|
||||
## License
|
||||
|
||||
[MIT License](https://opensource.org/licenses/MIT).
|
||||
|
||||
@@ -3,4 +3,4 @@
|
||||
|
||||
require 'youplot'
|
||||
|
||||
YouPlot::Command.new.run
|
||||
YouPlot::Command.new.run_as_executable
|
||||
|
||||
@@ -3,4 +3,4 @@
|
||||
|
||||
require 'youplot'
|
||||
|
||||
YouPlot::Command.new.run
|
||||
YouPlot::Command.new.run_as_executable
|
||||
|
||||
@@ -2,8 +2,16 @@
|
||||
|
||||
require 'unicode_plot'
|
||||
require 'youplot/version'
|
||||
require 'youplot/dsv_reader'
|
||||
require 'youplot/dsv'
|
||||
require 'youplot/command'
|
||||
|
||||
module YouPlot
|
||||
class << self
|
||||
attr_accessor :run_as_executable
|
||||
|
||||
def run_as_executable?
|
||||
@run_as_executable
|
||||
end
|
||||
end
|
||||
@run_as_executable = false
|
||||
end
|
||||
|
||||
@@ -6,9 +6,9 @@ module YouPlot
|
||||
module Processing
|
||||
module_function
|
||||
|
||||
def count_values(arr)
|
||||
def count_values(arr, tally: true)
|
||||
# tally was added in Ruby 2.7
|
||||
if Enumerable.method_defined? :tally
|
||||
if tally && Enumerable.method_defined?(:tally)
|
||||
arr.tally
|
||||
else
|
||||
# https://github.com/marcandre/backports
|
||||
|
||||
@@ -7,6 +7,8 @@ module YouPlot
|
||||
# plotting functions.
|
||||
module Backends
|
||||
module UnicodePlotBackend
|
||||
class Error < StandardError; end
|
||||
|
||||
module_function
|
||||
|
||||
def barplot(data, params, fmt = nil, count: false)
|
||||
@@ -37,7 +39,19 @@ module YouPlot
|
||||
labels = series[x_col]
|
||||
values = series[y_col].map(&:to_f)
|
||||
end
|
||||
begin
|
||||
UnicodePlot.barplot(labels, values, **params.to_hc)
|
||||
# UnicodePlot error:
|
||||
# All values have to be positive. Negative bars are not supported.
|
||||
rescue ArgumentError => e
|
||||
if YouPlot.run_as_executable?
|
||||
warn e.backtrace[0]
|
||||
warn "\e[35m#{e}\e[0m"
|
||||
exit 1
|
||||
else
|
||||
raise e
|
||||
end
|
||||
end
|
||||
end
|
||||
|
||||
def histogram(data, params)
|
||||
@@ -90,6 +104,7 @@ module YouPlot
|
||||
params.name ||= headers[1]
|
||||
params.xlabel ||= headers[0]
|
||||
end
|
||||
params.xlim ||= series[0].flatten.minmax # why need?
|
||||
params.ylim ||= series[1..-1].flatten.minmax # why need?
|
||||
plot = UnicodePlot.public_send(method1, series[0], series[1], **params.to_hc)
|
||||
2.upto(series.size - 1) do |i|
|
||||
@@ -103,13 +118,14 @@ module YouPlot
|
||||
series = data.series
|
||||
method2 = get_method2(method1)
|
||||
series.map! { |s| s.map(&:to_f) }
|
||||
series = series.each_slice(2).to_a
|
||||
series2 = series.each_slice(2).to_a
|
||||
series = nil
|
||||
params.name ||= headers[0] if headers
|
||||
params.xlim = series.map(&:first).flatten.minmax # why need?
|
||||
params.ylim = series.map(&:last).flatten.minmax # why need?
|
||||
x1, y1 = series.shift
|
||||
params.xlim ||= series2.map(&:first).flatten.minmax # why need?
|
||||
params.ylim ||= series2.map(&:last).flatten.minmax # why need?
|
||||
x1, y1 = series2.shift
|
||||
plot = UnicodePlot.public_send(method1, x1, y1, **params.to_hc)
|
||||
series.each_with_index do |(xi, yi), i|
|
||||
series2.each_with_index do |(xi, yi), i|
|
||||
UnicodePlot.public_send(method2, plot, xi, yi, name: headers&.[]((i + 1) * 2))
|
||||
end
|
||||
plot
|
||||
@@ -179,14 +195,14 @@ module YouPlot
|
||||
warn " Headers: \e[35m#{data.headers.inspect}\e[0m"
|
||||
warn " The first item is: \e[35m\"#{series[0][0]}\"\e[0m"
|
||||
warn " The last item is : \e[35m\"#{series[0][-1]}\"\e[0m"
|
||||
exit 1
|
||||
YouPlot.run_as_executable ? exit(1) : raise(Error)
|
||||
end
|
||||
if fmt == 'xyxy' && series.size.odd?
|
||||
warn 'YouPlot: In the xyxy format, the number of series must be even.'
|
||||
warn ''
|
||||
warn " Number of series: \e[35m#{series.size}\e[0m"
|
||||
warn " Headers: \e[35m#{data.headers.inspect}\e[0m"
|
||||
exit 1
|
||||
YouPlot.run_as_executable ? exit(1) : raise(Error)
|
||||
end
|
||||
end
|
||||
end
|
||||
|
||||
@@ -1,6 +1,6 @@
|
||||
# frozen_string_literal: true
|
||||
|
||||
require_relative 'dsv_reader'
|
||||
require_relative 'dsv'
|
||||
require_relative 'command/parser'
|
||||
|
||||
# FIXME
|
||||
@@ -22,6 +22,11 @@ module YouPlot
|
||||
@backend = YouPlot::Backends::UnicodePlotBackend
|
||||
end
|
||||
|
||||
def run_as_executable
|
||||
YouPlot.run_as_executable = true
|
||||
run
|
||||
end
|
||||
|
||||
def run
|
||||
parser.parse_options(@argv)
|
||||
@command ||= parser.command
|
||||
@@ -31,6 +36,18 @@ module YouPlot
|
||||
if %i[colors color colours colour].include? @command
|
||||
plot = create_plot
|
||||
output_plot(plot)
|
||||
elsif options[:progressive]
|
||||
stop = false
|
||||
Signal.trap(:INT) { stop = true }
|
||||
options[:output].print "\e[?25l" # make cursor invisible
|
||||
while (input = Kernel.gets)
|
||||
n = main_progressive(input)
|
||||
break if stop
|
||||
|
||||
options[:output].print "\e[#{n}F"
|
||||
end
|
||||
options[:output].print "\e[0J"
|
||||
options[:output].print "\e[?25h" # make cursor visible
|
||||
else
|
||||
# Sometimes the input file does not end with a newline code.
|
||||
while (input = Kernel.gets(nil))
|
||||
@@ -52,9 +69,31 @@ module YouPlot
|
||||
output_plot(plot)
|
||||
end
|
||||
|
||||
def main_progressive(input)
|
||||
output_data(input)
|
||||
|
||||
# FIXME
|
||||
# Worked around the problem of not being able to draw
|
||||
# plots when there is only one header line.
|
||||
if @raw_data.nil?
|
||||
@raw_data = String.new
|
||||
if options[:headers]
|
||||
@raw_data << input
|
||||
return
|
||||
end
|
||||
end
|
||||
@raw_data << input
|
||||
|
||||
# FIXME
|
||||
@data = read_dsv(@raw_data)
|
||||
|
||||
plot = create_plot
|
||||
output_plot_progressive(plot)
|
||||
end
|
||||
|
||||
def read_dsv(input)
|
||||
input = input.dup.force_encoding(options[:encoding]).encode('utf-8') if options[:encoding]
|
||||
DSVReader.input(input, options[:delimiter], options[:headers], options[:transpose])
|
||||
DSV.parse(input, options[:delimiter], options[:headers], options[:transpose])
|
||||
end
|
||||
|
||||
def create_plot
|
||||
@@ -106,5 +145,28 @@ module YouPlot
|
||||
end
|
||||
end
|
||||
end
|
||||
|
||||
def output_plot_progressive(plot)
|
||||
case options[:output]
|
||||
when IO
|
||||
# RefactorMe
|
||||
out = StringIO.new(String.new)
|
||||
def out.tty?
|
||||
true
|
||||
end
|
||||
plot.render(out)
|
||||
lines = out.string.lines
|
||||
lines.each do |line|
|
||||
options[:output].print line.chomp
|
||||
options[:output].print "\e[0K"
|
||||
options[:output].puts
|
||||
end
|
||||
options[:output].print "\e[0J"
|
||||
options[:output].flush
|
||||
out.string.lines.size
|
||||
else
|
||||
raise 'In progressive mode, output to a file is not possible.'
|
||||
end
|
||||
end
|
||||
end
|
||||
end
|
||||
|
||||
@@ -2,11 +2,12 @@
|
||||
|
||||
module YouPlot
|
||||
class Command
|
||||
CmdOptions = Struct.new(
|
||||
Options = Struct.new(
|
||||
:delimiter,
|
||||
:transpose,
|
||||
:headers,
|
||||
:pass,
|
||||
:progressive,
|
||||
:output,
|
||||
:fmt,
|
||||
:encoding,
|
||||
@@ -1,18 +1,21 @@
|
||||
# frozen_string_literal: true
|
||||
|
||||
require 'optparse'
|
||||
require_relative 'cmd_options'
|
||||
require_relative 'options'
|
||||
require_relative 'plot_params'
|
||||
|
||||
module YouPlot
|
||||
class Command
|
||||
class Parser
|
||||
attr_reader :command, :options, :params
|
||||
class Error < StandardError; end
|
||||
|
||||
attr_reader :command, :options, :params,
|
||||
:main_parser, :sub_parser
|
||||
|
||||
def initialize
|
||||
@command = nil
|
||||
|
||||
@options = CmdOptions.new(
|
||||
@options = Options.new(
|
||||
delimiter: "\t",
|
||||
transpose: false,
|
||||
headers: nil,
|
||||
@@ -28,84 +31,81 @@ module YouPlot
|
||||
end
|
||||
|
||||
def create_default_parser
|
||||
OptionParser.new do |opt|
|
||||
opt.program_name = 'YouPlot'
|
||||
opt.version = YouPlot::VERSION
|
||||
opt.summary_width = 24
|
||||
opt.on_tail('') # Add a blank line at the end
|
||||
opt.separator('')
|
||||
opt.on('Common options:')
|
||||
opt.on('-O', '--pass [FILE]', 'file to output input data to [stdout]',
|
||||
OptionParser.new do |parser|
|
||||
parser.program_name = 'YouPlot'
|
||||
parser.version = YouPlot::VERSION
|
||||
parser.summary_width = 24
|
||||
parser.on_tail('') # Add a blank line at the end
|
||||
parser.separator('')
|
||||
parser.on('Common options:')
|
||||
parser.on('-O', '--pass [FILE]', 'file to output input data to [stdout]',
|
||||
'for inserting YouPlot in the middle of Unix pipes') do |v|
|
||||
@options[:pass] = v || $stdout
|
||||
options[:pass] = v || $stdout
|
||||
end
|
||||
opt.on('-o', '--output [FILE]', 'file to output plots to [stdout]',
|
||||
parser.on('-o', '--output [FILE]', 'file to output plots to [stdout]',
|
||||
'If no option is specified, plot will print to stderr') do |v|
|
||||
@options[:output] = v || $stdout
|
||||
options[:output] = v || $stdout
|
||||
end
|
||||
opt.on('-d', '--delimiter VAL', String, 'use DELIM instead of TAB for field delimiter') do |v|
|
||||
@options[:delimiter] = v
|
||||
parser.on('-d', '--delimiter DELIM', String, 'use DELIM instead of [TAB] for field delimiter') do |v|
|
||||
options[:delimiter] = v
|
||||
end
|
||||
opt.on('-H', '--headers', TrueClass, 'specify that the input has header row') do |v|
|
||||
@options[:headers] = v
|
||||
parser.on('-H', '--headers', TrueClass, 'specify that the input has header row') do |v|
|
||||
options[:headers] = v
|
||||
end
|
||||
opt.on('-T', '--transpose', TrueClass, 'transpose the axes of the input data') do |v|
|
||||
@options[:transpose] = v
|
||||
parser.on('-T', '--transpose', TrueClass, 'transpose the axes of the input data') do |v|
|
||||
options[:transpose] = v
|
||||
end
|
||||
opt.on('-t', '--title VAL', String, 'print string on the top of plot') do |v|
|
||||
parser.on('-t', '--title STR', String, 'print string on the top of plot') do |v|
|
||||
params.title = v
|
||||
end
|
||||
opt.on('-x', '--xlabel VAL', String, 'print string on the bottom of the plot') do |v|
|
||||
parser.on('-x', '--xlabel STR', String, 'print string on the bottom of the plot') do |v|
|
||||
params.xlabel = v
|
||||
end
|
||||
opt.on('-y', '--ylabel VAL', String, 'print string on the far left of the plot') do |v|
|
||||
parser.on('-y', '--ylabel STR', String, 'print string on the far left of the plot') do |v|
|
||||
params.ylabel = v
|
||||
end
|
||||
opt.on('-w', '--width VAL', Integer, 'number of characters per row') do |v|
|
||||
parser.on('-w', '--width INT', Integer, 'number of characters per row') do |v|
|
||||
params.width = v
|
||||
end
|
||||
opt.on('-h', '--height VAL', Numeric, 'number of rows') do |v|
|
||||
parser.on('-h', '--height INT', Numeric, 'number of rows') do |v|
|
||||
params.height = v
|
||||
end
|
||||
opt.on('-b', '--border VAL', String, 'specify the style of the bounding box') do |v|
|
||||
parser.on('-b', '--border STR', String, 'specify the style of the bounding box') do |v|
|
||||
params.border = v.to_sym
|
||||
end
|
||||
opt.on('-m', '--margin VAL', Numeric, 'number of spaces to the left of the plot') do |v|
|
||||
parser.on('-m', '--margin INT', Numeric, 'number of spaces to the left of the plot') do |v|
|
||||
params.margin = v
|
||||
end
|
||||
opt.on('-p', '--padding VAL', Numeric, 'space of the left and right of the plot') do |v|
|
||||
parser.on('--padding INT', Numeric, 'space of the left and right of the plot') do |v|
|
||||
params.padding = v
|
||||
end
|
||||
opt.on('-c', '--color VAL', String, 'color of the drawing') do |v|
|
||||
parser.on('-c', '--color VAL', String, 'color of the drawing') do |v|
|
||||
params.color = v =~ /\A[0-9]+\z/ ? v.to_i : v.to_sym
|
||||
end
|
||||
opt.on('--[no-]labels', TrueClass, 'hide the labels') do |v|
|
||||
parser.on('--[no-]labels', TrueClass, 'hide the labels') do |v|
|
||||
params.labels = v
|
||||
end
|
||||
opt.on('--progress', TrueClass, 'progressive') do |v|
|
||||
@options[:progressive] = v
|
||||
parser.on('-p', '--progress', TrueClass, 'progressive mode [experimental]') do |v|
|
||||
options[:progressive] = v
|
||||
end
|
||||
opt.on('--encoding VAL', String, 'Specify the input encoding') do |v|
|
||||
@options[:encoding] = v
|
||||
parser.on('--encoding STR', String, 'Specify the input encoding') do |v|
|
||||
options[:encoding] = v
|
||||
end
|
||||
# Optparse adds the help option, but it doesn't show up in usage.
|
||||
# This is why you need the code below.
|
||||
opt.on('--help', 'print sub-command help menu') do
|
||||
puts opt.help
|
||||
exit
|
||||
parser.on('--help', 'print sub-command help menu') do
|
||||
puts parser.help
|
||||
exit if YouPlot.run_as_executable?
|
||||
end
|
||||
opt.on('--debug', TrueClass, 'print preprocessed data') do |v|
|
||||
@options[:debug] = v
|
||||
parser.on('--debug', TrueClass, 'print preprocessed data') do |v|
|
||||
options[:debug] = v
|
||||
end
|
||||
yield opt if block_given?
|
||||
# yield opt if block_given?
|
||||
end
|
||||
end
|
||||
|
||||
def main_parser
|
||||
@main_parser ||= create_default_parser do |main_parser|
|
||||
# Here, help message is stored in the banner.
|
||||
# Because help of main_parser may be referred by `sub_parser`.
|
||||
|
||||
def create_main_parser
|
||||
@main_parser = create_default_parser
|
||||
main_parser.banner = \
|
||||
<<~MSG
|
||||
|
||||
@@ -133,20 +133,56 @@ module YouPlot
|
||||
--version print the version of YouPlot
|
||||
MSG
|
||||
|
||||
# Actually, main_parser can take common optional arguments.
|
||||
# However, these options dose not be shown in the help menu.
|
||||
# I think the main help should be simple.
|
||||
# Help for the main parser is simple.
|
||||
# Simply show the banner above.
|
||||
main_parser.on('--help', 'print sub-command help menu') do
|
||||
puts main_parser.banner
|
||||
puts
|
||||
exit
|
||||
end
|
||||
exit if YouPlot.run_as_executable?
|
||||
end
|
||||
end
|
||||
|
||||
def sub_parser
|
||||
@sub_parser ||= create_default_parser do |parser|
|
||||
parser.banner = <<~MSG
|
||||
def sub_parser_add_symbol
|
||||
sub_parser.on_head('--symbol STR', String, 'character to be used to plot the bars') do |v|
|
||||
params.symbol = v
|
||||
end
|
||||
end
|
||||
|
||||
def sub_parser_add_xscale
|
||||
xscale_options = UnicodePlot::ValueTransformer::PREDEFINED_TRANSFORM_FUNCTIONS.keys.join(', ')
|
||||
sub_parser.on_head('--xscale STR', String, "axis scaling (#{xscale_options})") do |v|
|
||||
params.xscale = v
|
||||
end
|
||||
end
|
||||
|
||||
def sub_parser_add_canvas
|
||||
sub_parser.on_head('--canvas STR', String, 'type of canvas') do |v|
|
||||
params.canvas = v.to_sym
|
||||
end
|
||||
end
|
||||
|
||||
def sub_parser_add_xlim
|
||||
sub_parser.on_head('--xlim FLOAT,FLOAT', Array, 'plotting range for the x coordinate') do |v|
|
||||
params.xlim = v.take(2)
|
||||
end
|
||||
end
|
||||
|
||||
def sub_parser_add_ylim
|
||||
sub_parser.on_head('--ylim FLOAT,FLOAT', Array, 'plotting range for the y coordinate') do |v|
|
||||
params.ylim = v.take(2)
|
||||
end
|
||||
end
|
||||
|
||||
def sub_parser_add_grid
|
||||
sub_parser.on_head('--[no-]grid', TrueClass, 'draws grid-lines at the origin') do |v|
|
||||
params.grid = v
|
||||
end
|
||||
end
|
||||
|
||||
def create_sub_parser
|
||||
@sub_parser = create_default_parser
|
||||
sub_parser.banner = \
|
||||
<<~MSG
|
||||
|
||||
Usage: YouPlot #{command} [options] <in.tsv>
|
||||
|
||||
@@ -159,126 +195,101 @@ module YouPlot
|
||||
when nil
|
||||
warn main_parser.banner
|
||||
warn "\n"
|
||||
exit 1
|
||||
exit 1 if YouPlot.run_as_executable?
|
||||
|
||||
when :barplot, :bar
|
||||
parser.on_head('--symbol VAL', String, 'character to be used to plot the bars') do |v|
|
||||
params.symbol = v
|
||||
end
|
||||
parser.on_head('--xscale VAL', String, 'axis scaling') do |v|
|
||||
params.xscale = v
|
||||
end
|
||||
parser.on_head('--fmt VAL', String, 'xy : header is like x, y...', 'yx : header is like y, x...') do |v|
|
||||
@options[:fmt] = v
|
||||
sub_parser_add_symbol
|
||||
sub_parser.on_head('--fmt STR', String, 'xy : header is like x, y...', 'yx : header is like y, x...') do |v|
|
||||
options[:fmt] = v
|
||||
end
|
||||
sub_parser_add_xscale
|
||||
|
||||
when :count, :c
|
||||
parser.on_head('--symbol VAL', String, 'character to be used to plot the bars') do |v|
|
||||
params.symbol = v
|
||||
end
|
||||
sub_parser_add_symbol
|
||||
sub_parser_add_xscale
|
||||
|
||||
when :histogram, :hist
|
||||
parser.on_head('-n', '--nbins VAL', Numeric, 'approximate number of bins') do |v|
|
||||
params.nbins = v
|
||||
end
|
||||
parser.on_head('--closed VAL', String) do |v|
|
||||
sub_parser_add_symbol
|
||||
sub_parser.on_head('--closed STR', String, 'side of the intervals to be closed [left]') do |v|
|
||||
params.closed = v
|
||||
end
|
||||
parser.on_head('--symbol VAL', String, 'character to be used to plot the bars') do |v|
|
||||
params.symbol = v
|
||||
sub_parser.on_head('-n', '--nbins INT', Numeric, 'approximate number of bins') do |v|
|
||||
params.nbins = v
|
||||
end
|
||||
|
||||
when :lineplot, :line
|
||||
parser.on_head('--canvas VAL', String, 'type of canvas') do |v|
|
||||
params.canvas = v
|
||||
end
|
||||
parser.on_head('--xlim VAL', Array, 'plotting range for the x coordinate') do |v|
|
||||
params.xlim = v.take(2)
|
||||
end
|
||||
parser.on_head('--ylim VAL', Array, 'plotting range for the y coordinate') do |v|
|
||||
params.ylim = v.take(2)
|
||||
end
|
||||
parser.on_head('--fmt VAL', String, 'xy : header is like x, y...', 'yx : header is like y, x...') do |v|
|
||||
@options[:fmt] = v
|
||||
sub_parser_add_canvas
|
||||
sub_parser_add_grid
|
||||
sub_parser.on_head('--fmt STR', String, 'xy : header is like x, y...', 'yx : header is like y, x...') do |v|
|
||||
options[:fmt] = v
|
||||
end
|
||||
sub_parser_add_ylim
|
||||
sub_parser_add_xlim
|
||||
|
||||
when :lineplots, :lines
|
||||
parser.on_head('--canvas VAL', String) do |v|
|
||||
params.canvas = v
|
||||
end
|
||||
parser.on_head('--xlim VAL', Array, 'plotting range for the x coordinate') do |v|
|
||||
params.xlim = v.take(2)
|
||||
end
|
||||
parser.on_head('--ylim VAL', Array, 'plotting range for the y coordinate') do |v|
|
||||
params.ylim = v.take(2)
|
||||
end
|
||||
parser.on_head('--fmt VAL', String, 'xyxy : header is like x1, y1, x2, y2, x3, y3...',
|
||||
sub_parser_add_canvas
|
||||
sub_parser_add_grid
|
||||
sub_parser.on_head('--fmt STR', String, 'xyxy : header is like x1, y1, x2, y2, x3, y3...',
|
||||
'xyy : header is like x, y1, y2, y2, y3...') do |v|
|
||||
@options[:fmt] = v
|
||||
options[:fmt] = v
|
||||
end
|
||||
sub_parser_add_ylim
|
||||
sub_parser_add_xlim
|
||||
|
||||
when :scatter, :s
|
||||
parser.on_head('--canvas VAL', String) do |v|
|
||||
params.canvas = v
|
||||
end
|
||||
parser.on_head('--xlim VAL', Array, 'plotting range for the x coordinate') do |v|
|
||||
params.xlim = v.take(2)
|
||||
end
|
||||
parser.on_head('--ylim VAL', Array, 'plotting range for the y coordinate') do |v|
|
||||
params.ylim = v.take(2)
|
||||
end
|
||||
parser.on_head('--fmt VAL', String, 'xyxy : header is like x1, y1, x2, y2, x3, y3...',
|
||||
sub_parser_add_canvas
|
||||
sub_parser_add_grid
|
||||
sub_parser.on_head('--fmt STR', String, 'xyxy : header is like x1, y1, x2, y2, x3, y3...',
|
||||
'xyy : header is like x, y1, y2, y2, y3...') do |v|
|
||||
@options[:fmt] = v
|
||||
options[:fmt] = v
|
||||
end
|
||||
sub_parser_add_ylim
|
||||
sub_parser_add_xlim
|
||||
|
||||
when :density, :d
|
||||
parser.on_head('--grid', TrueClass) do |v|
|
||||
params.grid = v
|
||||
end
|
||||
parser.on_head('--xlim VAL', Array, 'plotting range for the x coordinate') do |v|
|
||||
params.xlim = v.take(2)
|
||||
end
|
||||
parser.on_head('--ylim VAL', Array, 'plotting range for the y coordinate') do |v|
|
||||
params.ylim = v.take(2)
|
||||
end
|
||||
parser.on('--fmt VAL', String, 'xyxy : header is like x1, y1, x2, y2, x3, y3...',
|
||||
sub_parser_add_canvas
|
||||
sub_parser_add_grid
|
||||
sub_parser.on('--fmt STR', String, 'xyxy : header is like x1, y1, x2, y2, x3, y3...',
|
||||
'xyy : header is like x, y1, y2, y2, y3...') do |v|
|
||||
@options[:fmt] = v
|
||||
options[:fmt] = v
|
||||
end
|
||||
sub_parser_add_ylim
|
||||
sub_parser_add_xlim
|
||||
|
||||
when :boxplot, :box
|
||||
parser.on_head('--xlim VAL', Array, 'plotting range for the x coordinate') do |v|
|
||||
params.xlim = v.take(2)
|
||||
end
|
||||
sub_parser_add_xlim
|
||||
|
||||
when :colors, :color, :colours, :colour
|
||||
parser.on_head('-n', '--names', 'show color names only', TrueClass) do |v|
|
||||
@options[:color_names] = v
|
||||
sub_parser.on_head('-n', '--names', 'show color names only', TrueClass) do |v|
|
||||
options[:color_names] = v
|
||||
end
|
||||
|
||||
else
|
||||
warn "uplot: unrecognized command '#{command}'"
|
||||
error_message = "uplot: unrecognized command '#{command}'"
|
||||
if YouPlot.run_as_executable?
|
||||
warn error_message
|
||||
exit 1
|
||||
else
|
||||
raise Error, error_message
|
||||
end
|
||||
end
|
||||
end
|
||||
|
||||
def parse_options(argv = ARGV)
|
||||
begin
|
||||
main_parser.order!(argv)
|
||||
create_main_parser.order!(argv)
|
||||
rescue OptionParser::ParseError => e
|
||||
warn "uplot: #{e.message}"
|
||||
exit 1
|
||||
exit 1 if YouPlot.run_as_executable?
|
||||
end
|
||||
|
||||
@command = argv.shift&.to_sym
|
||||
|
||||
begin
|
||||
sub_parser.parse!(argv)
|
||||
create_sub_parser&.parse!(argv)
|
||||
rescue OptionParser::ParseError => e
|
||||
warn "uplot: #{e.message}"
|
||||
exit 1
|
||||
exit 1 if YouPlot.run_as_executable?
|
||||
end
|
||||
end
|
||||
end
|
||||
|
||||
@@ -4,10 +4,10 @@ require 'csv'
|
||||
|
||||
module YouPlot
|
||||
# Read and interpret Delimiter-separated values format file or stream.
|
||||
module DSVReader
|
||||
module DSV
|
||||
module_function
|
||||
|
||||
def input(input, delimiter, headers, transpose)
|
||||
def parse(input, delimiter, headers, transpose)
|
||||
arr = parse_as_csv(input, delimiter)
|
||||
headers = get_headers(arr, headers, transpose)
|
||||
series = get_series(arr, headers, transpose)
|
||||
@@ -25,10 +25,10 @@ module YouPlot
|
||||
Data.new(headers, series)
|
||||
elsif h_size > s_size
|
||||
warn "\e[35mThe number of headers is greater than the number of series.\e[0m"
|
||||
exit 1
|
||||
exit 1 if YouPlot.run_as_executable?
|
||||
elsif h_size < s_size
|
||||
warn "\e[35mThe number of headers is less than the number of series.\e[0m"
|
||||
exit 1
|
||||
exit 1 if YouPlot.run_as_executable?
|
||||
end
|
||||
end
|
||||
end
|
||||
@@ -57,14 +57,18 @@ module YouPlot
|
||||
end
|
||||
|
||||
def get_series(arr, headers, transpose)
|
||||
if transpose
|
||||
if headers
|
||||
if arr.size > 1
|
||||
if transpose
|
||||
arr.map { |row| row[1..-1] }
|
||||
else
|
||||
arr
|
||||
end
|
||||
elsif headers
|
||||
transpose2(arr[1..-1])
|
||||
end
|
||||
else
|
||||
Array.new(arr[0].size, [])
|
||||
end
|
||||
elsif transpose
|
||||
arr
|
||||
else
|
||||
transpose2(arr)
|
||||
end
|
||||
@@ -1,5 +1,5 @@
|
||||
# frozen_string_literal: true
|
||||
|
||||
module YouPlot
|
||||
VERSION = '0.3.2'
|
||||
VERSION = '0.3.4'
|
||||
end
|
||||
|
||||
38
test/fixtures/iris-count.txt
vendored
Normal file
38
test/fixtures/iris-count.txt
vendored
Normal file
@@ -0,0 +1,38 @@
|
||||
sepal_length
|
||||
┌ ┐
|
||||
5.0 ┤■■■■■■■■■■■■■■■■■■■■■■■■■■■■■■■■■■ 10.0
|
||||
6.3 ┤■■■■■■■■■■■■■■■■■■■■■■■■■■■■■■■ 9.0
|
||||
5.1 ┤■■■■■■■■■■■■■■■■■■■■■■■■■■■■■■■ 9.0
|
||||
6.7 ┤■■■■■■■■■■■■■■■■■■■■■■■■■■■ 8.0
|
||||
5.7 ┤■■■■■■■■■■■■■■■■■■■■■■■■■■■ 8.0
|
||||
6.4 ┤■■■■■■■■■■■■■■■■■■■■■■■■ 7.0
|
||||
5.5 ┤■■■■■■■■■■■■■■■■■■■■■■■■ 7.0
|
||||
5.8 ┤■■■■■■■■■■■■■■■■■■■■■■■■ 7.0
|
||||
5.6 ┤■■■■■■■■■■■■■■■■■■■■ 6.0
|
||||
6.1 ┤■■■■■■■■■■■■■■■■■■■■ 6.0
|
||||
6.0 ┤■■■■■■■■■■■■■■■■■■■■ 6.0
|
||||
5.4 ┤■■■■■■■■■■■■■■■■■■■■ 6.0
|
||||
4.9 ┤■■■■■■■■■■■■■■■■■■■■ 6.0
|
||||
6.5 ┤■■■■■■■■■■■■■■■■■ 5.0
|
||||
4.8 ┤■■■■■■■■■■■■■■■■■ 5.0
|
||||
7.7 ┤■■■■■■■■■■■■■■ 4.0
|
||||
6.2 ┤■■■■■■■■■■■■■■ 4.0
|
||||
6.9 ┤■■■■■■■■■■■■■■ 4.0
|
||||
5.2 ┤■■■■■■■■■■■■■■ 4.0
|
||||
4.6 ┤■■■■■■■■■■■■■■ 4.0
|
||||
7.2 ┤■■■■■■■■■■ 3.0
|
||||
6.8 ┤■■■■■■■■■■ 3.0
|
||||
5.9 ┤■■■■■■■■■■ 3.0
|
||||
4.4 ┤■■■■■■■■■■ 3.0
|
||||
6.6 ┤■■■■■■■ 2.0
|
||||
4.7 ┤■■■■■■■ 2.0
|
||||
7.9 ┤■■■ 1.0
|
||||
7.4 ┤■■■ 1.0
|
||||
7.3 ┤■■■ 1.0
|
||||
7.6 ┤■■■ 1.0
|
||||
7.1 ┤■■■ 1.0
|
||||
7.0 ┤■■■ 1.0
|
||||
5.3 ┤■■■ 1.0
|
||||
4.5 ┤■■■ 1.0
|
||||
4.3 ┤■■■ 1.0
|
||||
└ ┘
|
||||
26
test/fixtures/iris-density.txt
vendored
26
test/fixtures/iris-density.txt
vendored
@@ -1,20 +1,20 @@
|
||||
IRIS-DENSITY
|
||||
┌────────────────────────────────────────┐
|
||||
6.9 │ │ sepal_width
|
||||
6.9 │ ░ │ sepal_width
|
||||
│ │ petal_length
|
||||
│ │ petal_width
|
||||
│ │ species
|
||||
│ ░ │ petal_width
|
||||
│ ░ ░░ │ species
|
||||
│ ░ ░ │
|
||||
│ ░ │
|
||||
│ ░ ░░ ░ │
|
||||
│ ▒░ ░ │
|
||||
│ ░ ░░ ░░ ░ ░ ░░ ░░░ │
|
||||
│ ░ ░ ░ ░ │
|
||||
│ ░░ ░ ░ │
|
||||
│ ░ ░░░▒ ░ ░ ░░░ ░ ░ │
|
||||
│ ░ ░░░░ │
|
||||
│ │
|
||||
│ ░ │
|
||||
│ ░ │
|
||||
│ ░ ░ ░░ ░ │
|
||||
│ ░ ░ ░ │
|
||||
│ │
|
||||
│ ░ ░▒ ░ ░ ░ ░ │
|
||||
│ ░ ░ ░ │
|
||||
│ │
|
||||
0 │ ░░ ▒ ░█ ░ ░▒ ░░ ░ ░░░ ░ │
|
||||
0 │ ░ ▒░▒▒██ ▒ ▓▒░▒▒░░░ ░▒▒░ ▒░░ ░ ░ │
|
||||
└────────────────────────────────────────┘
|
||||
4 8
|
||||
4.3 7.9
|
||||
sepal_length
|
||||
|
||||
32
test/fixtures/iris-lineplots.txt
vendored
32
test/fixtures/iris-lineplots.txt
vendored
@@ -1,20 +1,20 @@
|
||||
IRIS-LINEPLOTS
|
||||
┌────────────────────────────────────────┐
|
||||
6.9 │⠀⠀⠀⠀⠀⠀⠀⠀⠀⠀⠀⠀⠀⠀⠀⠀⠀⠀⠀⠀⠀⠀⠀⠀⠀⠀⠀⠀⠀⠀⠀⠀⠀⣀⣤⣲⠭⠃⠀⠀│ sepal_width
|
||||
│⠀⠀⠀⠀⠀⠀⠀⠀⠀⠀⠀⠀⠀⠀⠀⠀⠀⠀⠀⠀⠀⠀⠀⡀⠀⠀⠀⢀⣀⣠⣤⣶⣿⣿⣯⣴⣒⠖⠉⠁│ petal_length
|
||||
│⠀⠀⠀⠀⠀⠀⠀⠀⠀⠀⠀⠀⠀⠀⠀⠀⠀⠀⠀⠀⢀⣤⢮⣤⣤⣶⣿⣿⣿⠿⠛⠛⠋⠉⠀⠀⠀⠀⠀⠀│ petal_width
|
||||
│⠀⠀⠀⠀⠀⠀⠀⠀⠀⠀⠀⠀⠀⠀⠀⠀⢀⣀⣤⣴⣷⣿⣿⣿⣿⣿⣿⣟⣟⡂⠀⠀⠀⠀⠀⠀⠀⠀⠀⠀│ species
|
||||
│⠀⠀⠀⠀⠀⠀⠀⠀⠀⠀⢀⣀⠤⠔⠒⢙⡻⠝⢋⡽⢝⣳⣾⣫⣥⣒⣪⣵⣖⣂⡀⠀⠀⠀⠀⠀⠀⠀⠀⠀│
|
||||
│⠀⠀⠀⠀⠀⠀⠀⠀⠀⠉⠁⠀⠀⢀⣉⣟⣻⣿⣻⣿⣿⣿⠿⣿⣿⠿⠟⡢⠒⠁⠀⠀⠀⠀⠀⠀⠀⠀⠀⠀│
|
||||
│⠀⠀⠀⠀⠀⠀⠀⠀⠀⠀⣠⣤⣿⣷⣾⣿⡿⣿⡯⠿⠛⠋⠉⠀⣀⠔⠉⠀⠀⠀⠀⠀⠀⠀⠀⢀⣀⣄⣀⠄│
|
||||
│⠀⠀⠀⠀⢀⣨⣽⣿⣿⣿⣿⣿⣿⣿⣵⣚⣉⣃⣀⣠⣤⣤⣔⣮⣤⣄⣀⣠⣤⣔⣲⣾⡳⠮⠛⠋⢉⡗⠁⠀│
|
||||
│⠀⠀⠐⠒⡿⠿⠟⡻⠛⠛⠛⠚⠉⠀⠲⣶⣿⣷⣾⣷⣿⣿⣷⣿⣿⣿⣿⣿⣿⣿⣿⣿⣿⣷⣶⣶⣷⡇⠀⠀│
|
||||
│⠀⠀⠀⠀⢱⡠⠊⠀⠀⣤⣤⣶⣿⣿⠿⣿⣿⣿⣿⣿⣟⣿⣿⣟⣟⣉⣉⣝⣛⣫⣭⣥⣤⣤⣔⣒⣒⡃⠀⠀│
|
||||
│⠀⠀⠀⠀⠀⠁⠀⢀⡀⠀⢯⠒⠉⡠⠔⠡⠤⠮⣤⣴⣿⣿⣿⣿⣿⣿⣿⣿⣿⣷⣿⣶⣶⣶⣶⣿⣿⠥⠤⠄│
|
||||
│⠀⠀⠀⠀⣀⣠⣄⣤⣭⣿⣿⣿⣿⣿⣿⣿⣿⣯⣯⣯⣭⣽⣿⣿⣿⣿⣿⣯⣭⣍⡙⠛⠝⠉⠀⠀⠀⠀⠀⠀│
|
||||
│⠀⠀⠠⠴⠿⢯⠭⠿⠯⣭⣷⡾⠿⠿⠿⣿⢿⡿⡻⠿⡟⠛⢛⣛⠯⠭⠒⠒⠉⠉⠀⠀⠀⠀⠀⠀⠀⠀⠀⠀│
|
||||
│⠀⠀⠀⠀⠀⠀⠀⠀⣀⣀⣄⠀⠀⠀⢀⣀⡠⠤⠔⠒⠊⠉⠁⠀⠀⠀⠀⠀⠀⠀⠀⠀⠀⠀⠀⠀⠀⠀⠀⠀│
|
||||
0 │⠀⠀⢀⣀⣴⣶⣾⣿⣿⣿⣿⣿⣿⣿⣿⣿⣻⣷⣄⣀⣀⣀⣀⣀⣀⣀⣀⣀⣀⣀⣀⣀⣀⣀⣀⣀⣀⣀⣀⡀│
|
||||
6.9 │⠀⠀⠀⠀⠀⠀⠀⠀⠀⠀⠀⠀⠀⠀⠀⠀⠀⠀⠀⠀⠀⠀⠀⠀⠀⠀⠀⠀⠀⠀⠀⠀⠀⣀⣠⣴⡮⠟⠀⠀│ sepal_width
|
||||
│⠀⠀⠀⠀⠀⠀⠀⠀⠀⠀⠀⠀⠀⠀⠀⠀⠀⠀⠀⠀⠀⠀⡀⠀⠀⠀⠀⣀⣀⣤⣴⣶⣿⣟⣯⣥⣔⣲⠊⠉│ petal_length
|
||||
│⠀⠀⠀⠀⠀⠀⠀⠀⠀⠀⠀⠀⠀⠀⠀⠀⠀⠀⠀⢀⣔⢾⣥⣤⣶⣿⣿⣿⣿⠿⠛⠛⠋⠉⠀⠀⠀⠀⠀⠀│ petal_width
|
||||
│⠀⠀⠀⠀⠀⠀⠀⠀⠀⠀⠀⠀⠀⠀⠀⣀⣠⣤⣾⣿⣿⣿⣿⣿⣿⣿⣿⣛⣗⠀⠀⠀⠀⠀⠀⠀⠀⠀⠀⠀│ species
|
||||
│⠀⠀⠀⠀⠀⠀⠀⠀⣀⣀⠤⠔⠒⣋⡻⠭⠛⣩⡿⣟⣷⣽⣫⣥⣒⣲⣭⣶⣒⣀⠀⠀⠀⠀⠀⠀⠀⠀⠀⠀│
|
||||
│⠀⠀⠀⠀⠀⠀⠈⠉⠀⠀⠀⢀⣉⡟⣛⣿⣝⣻⣿⣿⣿⠿⢿⣿⡿⠿⣛⠤⠊⠁⠀⠀⠀⠀⠀⠀⠀⠀⠀⠀│
|
||||
│⠀⠀⠀⠀⠀⠀⠀⢀⣠⣤⣿⣷⣿⣿⣿⣿⣿⠿⠿⠛⠋⠉⠁⣀⠔⠊⠀⠀⠀⠀⠀⠀⠀⠀⠀⢀⣀⣠⢀⣠│
|
||||
│⠀⢀⣀⣭⣿⣿⣿⣿⣿⣿⣿⣿⣽⣖⣋⣙⣀⣀⣤⣤⣤⣔⣮⣤⣄⣀⣀⣤⣤⣔⣶⣾⡳⠮⠝⠓⢊⢽⠋⠀│
|
||||
│⠒⢷⠿⠿⢛⠟⠛⠙⠑⠚⠉⠀⠲⣶⣿⣿⣶⣿⣷⣿⣿⣷⣿⣿⣿⣿⣿⣿⣿⣿⣿⣿⣿⣷⣶⣶⣷⣾⠀⠀│
|
||||
│⠀⠸⡠⠔⠁⠀⢠⡤⣴⣶⣿⣿⠿⣿⣿⣿⢿⣿⣿⣿⣿⣿⣟⣟⣉⣉⣩⣛⣛⣭⣭⣥⣤⣤⣔⣒⣒⡚⠀⠀│
|
||||
│⠀⠀⠁⠀⠀⢀⡀⠨⢞⠊⢉⡠⠔⠉⠤⠴⢥⣴⣾⣿⣿⣿⣿⣿⣿⣿⣿⣿⣿⣶⣷⣶⣶⣶⣶⣿⣿⡭⠤⠤│
|
||||
│⠀⣀⣀⣄⣤⣤⣽⣿⣿⣿⣿⣿⣿⡿⣿⣿⣽⣽⣯⣭⣿⣿⣿⣿⣿⣿⣿⣭⣭⣉⠛⠛⠝⠉⠀⠀⠀⠀⠀⠀│
|
||||
│⠤⠿⠿⡯⠽⠿⢭⣽⣶⡾⠿⠿⠿⣿⠿⣿⢟⠿⢻⠟⠛⣛⣛⠯⠭⠝⠒⠊⠉⠁⠀⠀⠀⠀⠀⠀⠀⠀⠀⠀│
|
||||
│⠀⠀⠀⠀⠀⢀⣀⡠⣀⠀⠀⠀⢀⣀⡠⠤⠤⠒⠒⠉⠉⠀⠀⠀⠀⠀⠀⠀⠀⠀⠀⠀⠀⠀⠀⠀⠀⠀⠀⠀│
|
||||
0 │⣀⣴⣶⣾⣿⣷⣿⣿⣿⣿⣿⣿⣿⣿⣿⣿⣦⣀⣀⣀⣀⣀⣀⣀⣀⣀⣀⣀⣀⣀⣀⣀⣀⣀⣀⣀⣀⣀⣀⣀│
|
||||
└────────────────────────────────────────┘
|
||||
4 8
|
||||
4.3 7.9
|
||||
sepal_length
|
||||
|
||||
32
test/fixtures/iris-scatter.txt
vendored
32
test/fixtures/iris-scatter.txt
vendored
@@ -1,20 +1,20 @@
|
||||
IRIS-SCATTER
|
||||
┌────────────────────────────────────────┐
|
||||
6.9 │⠀⠀⠀⠀⠀⠀⠀⠀⠀⠀⠀⠀⠀⠀⠀⠀⠀⠀⠀⠀⠀⠀⠀⠀⠀⠀⠀⠀⠀⠀⠀⠀⠀⠀⠀⠀⠄⠃⠀⠀│ sepal_width
|
||||
│⠀⠀⠀⠀⠀⠀⠀⠀⠀⠀⠀⠀⠀⠀⠀⠀⠀⠀⠀⠀⠀⠀⠀⡀⠀⠀⠀⠀⠀⠀⠀⠀⡄⠂⠄⠀⠀⠄⠀⠁│ petal_length
|
||||
│⠀⠀⠀⠀⠀⠀⠀⠀⠀⠀⠀⠀⠀⠀⠀⠀⠀⠀⠀⠀⢀⠀⠀⡀⡀⠂⠀⡆⠁⠄⠈⠀⠂⠀⠀⠀⠀⠀⠀⠀│ petal_width
|
||||
│⠀⠀⠀⠀⠀⠀⠀⠀⠀⠀⠀⠀⠀⠀⠀⠀⠀⠀⡀⡀⡀⠀⠂⡀⠃⡅⠀⠄⠁⡂⠀⠀⠀⠀⠀⠀⠀⠀⠀⠀│ species
|
||||
│⠀⠀⠀⠀⠀⠀⠀⠀⠀⠀⠀⠀⠀⠀⠀⠐⠀⠁⠀⠄⢕⠀⠄⡃⠀⠀⠀⡁⠄⠂⡀⠀⠀⠀⠀⠀⠀⠀⠀⠀│
|
||||
│⠀⠀⠀⠀⠀⠀⠀⠀⠀⠁⠀⠀⠀⠀⠁⣊⠀⡃⠀⡀⠉⠀⠅⠂⠅⠙⠀⠂⠀⠀⠀⠀⠀⠀⠀⠀⠀⠀⠀⠀│
|
||||
│⠀⠀⠀⠀⠀⠀⠀⠀⠀⠀⢠⠀⢅⠀⡄⡮⠀⠅⠇⠀⠒⠀⠀⠀⠀⠀⠀⠀⠀⠀⠀⠀⠀⠀⠀⠀⠀⠄⠀⠄│
|
||||
│⠀⠀⠀⠀⠀⠨⠀⠠⠀⡀⣷⠀⠆⠀⠄⠊⠀⠂⠀⠀⠄⠀⠄⡄⠀⠀⠀⡀⠀⠀⠀⠀⠁⠀⠀⠀⠀⠀⠀⠀│
|
||||
│⠀⠀⠐⠀⠇⠘⠀⠑⠀⠂⠓⠀⠀⠀⠂⢰⠀⡆⡀⠃⢶⠀⡄⡄⡇⡳⠀⠂⡃⠃⠑⠀⠃⠄⡀⠀⠂⡂⠀⠀│
|
||||
│⠀⠀⠀⠀⠀⠀⠀⠀⠀⡄⠠⠀⠁⠀⠀⡮⠀⠆⡃⠀⠑⠀⠀⡅⠁⠀⠀⡄⠀⠀⠀⠀⠄⠀⠀⠀⠀⠂⠀⠀│
|
||||
│⠀⠀⠀⠀⠀⠁⠀⢀⠀⠀⢅⠀⠀⠀⠀⠡⠀⠄⡀⠀⠁⠀⠁⡁⡃⠅⠀⠃⠃⠃⠐⠀⠀⠀⡀⠀⠂⠅⠀⠄│
|
||||
│⠀⠀⠀⠀⡀⢠⠀⢤⠀⡆⣴⠀⡤⠀⠆⡠⠀⠆⠀⠅⢍⠀⠅⠅⠅⢅⠀⡇⡀⠄⡀⠀⠅⠁⠀⠀⠀⠀⠀⠀│
|
||||
│⠀⠀⠠⠀⠁⢁⠀⠁⠀⡀⡣⠀⠀⠀⠁⡯⠀⡃⡂⠀⡘⠀⠁⠁⠁⠈⠀⠀⠀⠀⠀⠀⠀⠀⠀⠀⠀⠀⠀⠀│
|
||||
│⠀⠀⠀⠀⠀⠀⠀⠀⠀⠀⢄⠀⠀⠀⠀⠀⠀⠀⠀⠀⠀⠀⠀⠀⠀⠀⠀⠀⠀⠀⠀⠀⠀⠀⠀⠀⠀⠀⠀⠀│
|
||||
0 │⠀⠀⢀⠀⡄⣲⠀⣴⠀⡄⣿⠀⣤⠀⡅⣄⠀⡃⡄⡀⣀⠀⡀⡀⡀⣀⠀⡀⡀⡀⣀⠀⡀⡀⡀⠀⡀⡀⠀⡀│
|
||||
6.9 │⠀⠀⠀⠀⠀⠀⠀⠀⠀⠀⠀⠀⠀⠀⠀⠀⠀⠀⠀⠀⠀⠀⠀⠀⠀⠀⠀⠀⠀⠀⠀⠀⠀⠀⠀⠀⠠⠘⠀⠀│ sepal_width
|
||||
│⠀⠀⠀⠀⠀⠀⠀⠀⠀⠀⠀⠀⠀⠀⠀⠀⠀⠀⠀⠀⠀⠀⡀⠀⠀⠀⠀⠀⠀⠀⠀⠀⡄⠂⠄⠀⠀⠠⠀⠈│ petal_length
|
||||
│⠀⠀⠀⠀⠀⠀⠀⠀⠀⠀⠀⠀⠀⠀⠀⠀⠀⠀⠀⢀⠀⠀⡀⡀⠂⠀⢰⠈⠠⠀⠀⠁⠂⠀⠀⠀⠀⠀⠀⠀│ petal_width
|
||||
│⠀⠀⠀⠀⠀⠀⠀⠀⠀⠀⠀⠀⠀⠀⠀⠀⢀⢀⢀⠀⠀⠂⡀⠃⡅⠀⠠⠈⢐⠀⠀⠀⠀⠀⠀⠀⠀⠀⠀⠀│ species
|
||||
│⠀⠀⠀⠀⠀⠀⠀⠀⠀⠀⠀⠀⠀⠀⠂⠈⠀⠠⠨⢐⠀⠄⡃⠀⠀⠀⢈⠠⠐⢀⠀⠀⠀⠀⠀⠀⠀⠀⠀⠀│
|
||||
│⠀⠀⠀⠀⠀⠀⠈⠀⠀⠀⠀⠀⠁⡂⡁⢘⠀⢀⠈⠈⠀⠅⠂⠅⠁⠘⠐⠀⠀⠀⠀⠀⠀⠀⠀⠀⠀⠀⠀⠀│
|
||||
│⠀⠀⠀⠀⠀⠀⠀⠀⢠⠀⠅⡀⡄⡆⠅⠨⠸⠀⠐⠐⠀⠀⠀⠀⠀⠀⠀⠀⠀⠀⠀⠀⠀⠀⠀⠀⠀⠠⠀⠠│
|
||||
│⠀⠀⠀⠅⠀⠠⢀⢸⢰⠀⠆⠀⠄⠂⠁⠐⠀⠀⠠⠀⠀⠄⡄⠀⠀⠀⢀⠀⠀⠀⠀⠀⠁⠀⠀⠀⠀⠀⠀⠀│
|
||||
│⠂⠇⠀⠃⠁⠐⠐⠘⠐⠀⠀⠀⠂⠀⡆⢰⢀⠘⠰⢰⠀⡄⡄⡇⡃⠰⠐⢘⠘⠈⠀⠂⠃⠄⡀⠀⠐⢐⠀⠀│
|
||||
│⠀⠀⠀⠀⠀⠀⢠⠀⠠⠀⠁⠀⠀⡆⠅⠰⢘⠀⠈⠐⠀⠀⡅⠁⠀⠀⢠⠀⠀⠀⠀⠀⠄⠀⠀⠀⠀⠐⠀⠀│
|
||||
│⠀⠀⠁⠀⠀⢀⠀⠨⢀⠀⠀⠀⠀⠁⠄⠠⢀⠀⠈⠀⠀⠁⡁⡃⠅⠀⠘⠘⠘⠀⠀⠂⠀⠀⡀⠀⠐⠨⠀⠠│
|
||||
│⠀⡀⠀⡄⠄⢠⢰⢠⢰⠀⡄⠄⠆⡀⠄⠰⠀⠨⠨⢈⠀⠅⠅⠅⠅⢀⢸⢀⠠⢀⠀⠀⠅⠁⠀⠀⠀⠀⠀⠀│
|
||||
│⠄⠁⠁⡀⠁⠀⢀⢘⠠⠀⠀⠀⠁⡇⠅⢘⢐⠀⢀⠘⠀⠁⠁⠁⠀⠈⠀⠀⠀⠀⠀⠀⠀⠀⠀⠀⠀⠀⠀⠀│
|
||||
│⠀⠀⠀⠀⠀⠀⠀⠠⢀⠀⠀⠀⠀⠀⠀⠀⠀⠀⠀⠀⠀⠀⠀⠀⠀⠀⠀⠀⠀⠀⠀⠀⠀⠀⠀⠀⠀⠀⠀⠀│
|
||||
0 │⡀⡄⡂⡆⡄⢰⢠⢸⢸⠀⡄⡄⡅⡄⡀⢘⢠⢀⢀⢀⠀⡀⡀⡀⡀⢀⢀⢀⢀⢀⠀⡀⡀⡀⡀⠀⢀⢀⠀⢀│
|
||||
└────────────────────────────────────────┘
|
||||
4 8
|
||||
4.3 7.9
|
||||
sepal_length
|
||||
|
||||
BIN
test/fixtures/iris_utf16.csv
vendored
Normal file
BIN
test/fixtures/iris_utf16.csv
vendored
Normal file
Binary file not shown.
|
6
test/fixtures/simple-boxplot.txt
vendored
Normal file
6
test/fixtures/simple-boxplot.txt
vendored
Normal file
@@ -0,0 +1,6 @@
|
||||
┌ ┐
|
||||
╷ ┌──────────┬──────────┐ ╷
|
||||
1 ├───────┤ │ ├────────┤
|
||||
╵ └──────────┴──────────┘ ╵
|
||||
└ ┘
|
||||
-50 0 50
|
||||
9
test/fixtures/simple-histogram.txt
vendored
Normal file
9
test/fixtures/simple-histogram.txt
vendored
Normal file
@@ -0,0 +1,9 @@
|
||||
┌ ┐
|
||||
[-60.0, -40.0) ┤▇▇▇▇▇▇▇▇▇▇▇▇▇▇▇▇▇▇▇ 1
|
||||
[-40.0, -20.0) ┤▇▇▇▇▇▇▇▇▇▇▇▇▇▇▇▇▇▇▇▇▇▇▇▇▇▇▇▇▇▇▇▇▇▇▇▇▇ 2
|
||||
[-20.0, 0.0) ┤▇▇▇▇▇▇▇▇▇▇▇▇▇▇▇▇▇▇▇▇▇▇▇▇▇▇▇▇▇▇▇▇▇▇▇▇▇ 2
|
||||
[ 0.0, 20.0) ┤▇▇▇▇▇▇▇▇▇▇▇▇▇▇▇▇▇▇▇ 1
|
||||
[ 20.0, 40.0) ┤▇▇▇▇▇▇▇▇▇▇▇▇▇▇▇▇▇▇▇▇▇▇▇▇▇▇▇▇▇▇▇▇▇▇▇▇▇ 2
|
||||
[ 40.0, 60.0) ┤▇▇▇▇▇▇▇▇▇▇▇▇▇▇▇▇▇▇▇▇▇▇▇▇▇▇▇▇▇▇▇▇▇▇▇▇▇ 2
|
||||
└ ┘
|
||||
Frequency
|
||||
20
test/fixtures/simple-lineplot-height-17.txt
vendored
Normal file
20
test/fixtures/simple-lineplot-height-17.txt
vendored
Normal file
@@ -0,0 +1,20 @@
|
||||
┌────────────────────────────────────────┐
|
||||
50 │⠀⠀⠀⠀⠀⠀⠀⠀⠀⠀⠀⠀⠀⠀⠀⠀⠀⠀⠀⠀⠀⠀⠀⠀⠀⠀⠀⠀⠀⠀⠀⠀⠀⠀⠀⠀⠀⠀⠀⢸│
|
||||
│⠀⠀⠀⠀⠀⠀⠀⠀⠀⠀⠀⠀⠀⠀⠀⠀⠀⠀⠀⠀⠀⠀⠀⠀⠀⠀⠀⠀⠀⠀⠀⡄⠀⠀⠀⠀⠀⠀⠀⢸│
|
||||
│⠀⠀⠀⠀⠀⠀⠀⠀⠀⠀⠀⠀⠀⠀⠀⠀⠀⠀⠀⠀⠀⠀⠀⠀⠀⠀⠀⠀⠀⠀⢸⡇⠀⠀⠀⠀⠀⠀⠀⡇│
|
||||
│⠀⠀⠀⠀⠀⠀⠀⠀⠀⠀⠀⠀⠀⠀⠀⠀⠀⠀⠀⠀⠀⠀⡆⠀⠀⠀⠀⠀⠀⠀⡸⢸⠀⠀⠀⠀⠀⠀⠀⡇│
|
||||
│⠀⠀⠀⠀⠀⠀⠀⠀⠀⠀⠀⠀⠀⠀⠀⠀⠀⠀⠀⠀⠀⢸⢸⠀⠀⠀⠀⠀⠀⠀⡇⠸⡀⠀⠀⠀⠀⠀⢸⠀│
|
||||
│⠀⠀⠀⠀⠀⠀⠀⠀⠀⠀⠀⠀⢠⢣⠀⠀⠀⠀⠀⠀⠀⡇⠘⡄⠀⠀⠀⠀⠀⢰⠁⠀⡇⠀⠀⠀⠀⠀⡸⠀│
|
||||
│⠀⠀⠀⠀⡀⠀⠀⠀⠀⠀⠀⠀⡎⠘⡄⠀⠀⠀⠀⠀⢰⠁⠀⢇⠀⠀⠀⠀⠀⡸⠀⠀⢣⠀⠀⠀⠀⠀⡇⠀│
|
||||
│⠀⠀⢀⠜⠘⡄⠀⠀⠀⠀⠀⢸⠀⠀⢱⠀⠀⠀⠀⠀⡜⠀⠀⢸⠀⠀⠀⠀⠀⡇⠀⠀⢸⠀⠀⠀⠀⢀⠇⠀│
|
||||
│⠤⢤⠮⠤⠤⠼⡤⠤⠤⠤⢤⠧⠤⠤⠬⡦⠤⠤⠤⢤⠧⠤⠤⠬⡦⠤⠤⠤⢴⠥⠤⠤⠬⡦⠤⠤⠤⢼⠤⠤│
|
||||
│⡰⠁⠀⠀⠀⠀⠱⡀⠀⠀⡜⠀⠀⠀⠀⢱⠀⠀⠀⡸⠀⠀⠀⠀⢣⠀⠀⠀⡸⠀⠀⠀⠀⢇⠀⠀⠀⡸⠀⠀│
|
||||
│⠁⠀⠀⠀⠀⠀⠀⢣⠀⢰⠁⠀⠀⠀⠀⠈⡆⠀⢀⠇⠀⠀⠀⠀⠸⡀⠀⠀⡇⠀⠀⠀⠀⢸⠀⠀⠀⡇⠀⠀│
|
||||
│⠀⠀⠀⠀⠀⠀⠀⠀⢣⠇⠀⠀⠀⠀⠀⠀⢱⠀⢸⠀⠀⠀⠀⠀⠀⡇⠀⢰⠁⠀⠀⠀⠀⠘⡄⠀⢠⠃⠀⠀│
|
||||
│⠀⠀⠀⠀⠀⠀⠀⠀⠀⠀⠀⠀⠀⠀⠀⠀⠈⡆⡇⠀⠀⠀⠀⠀⠀⢱⠀⡸⠀⠀⠀⠀⠀⠀⡇⠀⢸⠀⠀⠀│
|
||||
│⠀⠀⠀⠀⠀⠀⠀⠀⠀⠀⠀⠀⠀⠀⠀⠀⠀⠸⠀⠀⠀⠀⠀⠀⠀⠘⡄⡇⠀⠀⠀⠀⠀⠀⢱⠀⡜⠀⠀⠀│
|
||||
│⠀⠀⠀⠀⠀⠀⠀⠀⠀⠀⠀⠀⠀⠀⠀⠀⠀⠀⠀⠀⠀⠀⠀⠀⠀⠀⢷⠁⠀⠀⠀⠀⠀⠀⢸⠀⡇⠀⠀⠀│
|
||||
│⠀⠀⠀⠀⠀⠀⠀⠀⠀⠀⠀⠀⠀⠀⠀⠀⠀⠀⠀⠀⠀⠀⠀⠀⠀⠀⠘⠀⠀⠀⠀⠀⠀⠀⠀⣧⠃⠀⠀⠀│
|
||||
-50 │⠀⠀⠀⠀⠀⠀⠀⠀⠀⠀⠀⠀⠀⠀⠀⠀⠀⠀⠀⠀⠀⠀⠀⠀⠀⠀⠀⠀⠀⠀⠀⠀⠀⠀⠀⢿⠀⠀⠀⠀│
|
||||
└────────────────────────────────────────┘
|
||||
1 10
|
||||
18
test/fixtures/simple-lineplot-margin-17.txt
vendored
Normal file
18
test/fixtures/simple-lineplot-margin-17.txt
vendored
Normal file
@@ -0,0 +1,18 @@
|
||||
┌────────────────────────────────────────┐
|
||||
50 │⠀⠀⠀⠀⠀⠀⠀⠀⠀⠀⠀⠀⠀⠀⠀⠀⠀⠀⠀⠀⠀⠀⠀⠀⠀⠀⠀⠀⠀⠀⠀⠀⠀⠀⠀⠀⠀⠀⠀⢸│
|
||||
│⠀⠀⠀⠀⠀⠀⠀⠀⠀⠀⠀⠀⠀⠀⠀⠀⠀⠀⠀⠀⠀⠀⠀⠀⠀⠀⠀⠀⠀⠀⠀⡄⠀⠀⠀⠀⠀⠀⠀⡸│
|
||||
│⠀⠀⠀⠀⠀⠀⠀⠀⠀⠀⠀⠀⠀⠀⠀⠀⠀⠀⠀⠀⠀⠀⠀⠀⠀⠀⠀⠀⠀⠀⢸⢇⠀⠀⠀⠀⠀⠀⠀⡇│
|
||||
│⠀⠀⠀⠀⠀⠀⠀⠀⠀⠀⠀⠀⠀⠀⠀⠀⠀⠀⠀⠀⠀⢠⢇⠀⠀⠀⠀⠀⠀⠀⡎⢸⠀⠀⠀⠀⠀⠀⢠⠃│
|
||||
│⠀⠀⠀⠀⠀⠀⠀⠀⠀⠀⠀⠀⠀⡄⠀⠀⠀⠀⠀⠀⠀⡜⢸⠀⠀⠀⠀⠀⠀⢠⠃⠈⡆⠀⠀⠀⠀⠀⢸⠀│
|
||||
│⠀⠀⠀⠀⠀⠀⠀⠀⠀⠀⠀⠀⡸⠸⡀⠀⠀⠀⠀⠀⢠⠃⠀⡇⠀⠀⠀⠀⠀⢸⠀⠀⢇⠀⠀⠀⠀⠀⡎⠀│
|
||||
│⠀⠀⠀⡠⠳⡀⠀⠀⠀⠀⠀⢠⠃⠀⢣⠀⠀⠀⠀⠀⡜⠀⠀⢱⠀⠀⠀⠀⠀⡇⠀⠀⢸⠀⠀⠀⠀⠀⡇⠀│
|
||||
│⠤⢤⠼⠤⠤⠵⡤⠤⠤⠤⢤⠧⠤⠤⠼⡤⠤⠤⠤⢤⠧⠤⠤⠬⡦⠤⠤⠤⢴⠥⠤⠤⠬⡦⠤⠤⠤⢼⠤⠤│
|
||||
│⡠⠃⠀⠀⠀⠀⠱⡀⠀⠀⡜⠀⠀⠀⠀⢱⠀⠀⠀⡸⠀⠀⠀⠀⢣⠀⠀⠀⡸⠀⠀⠀⠀⡇⠀⠀⠀⡜⠀⠀│
|
||||
│⠁⠀⠀⠀⠀⠀⠀⠱⡀⡰⠁⠀⠀⠀⠀⠀⡇⠀⢀⠇⠀⠀⠀⠀⠸⡀⠀⠀⡇⠀⠀⠀⠀⢸⠀⠀⠀⡇⠀⠀│
|
||||
│⠀⠀⠀⠀⠀⠀⠀⠀⠱⠃⠀⠀⠀⠀⠀⠀⠸⡀⡸⠀⠀⠀⠀⠀⠀⢇⠀⢸⠀⠀⠀⠀⠀⠘⡄⠀⢰⠁⠀⠀│
|
||||
│⠀⠀⠀⠀⠀⠀⠀⠀⠀⠀⠀⠀⠀⠀⠀⠀⠀⢇⠇⠀⠀⠀⠀⠀⠀⢸⠀⡎⠀⠀⠀⠀⠀⠀⡇⠀⢸⠀⠀⠀│
|
||||
│⠀⠀⠀⠀⠀⠀⠀⠀⠀⠀⠀⠀⠀⠀⠀⠀⠀⠈⠀⠀⠀⠀⠀⠀⠀⠀⣇⠇⠀⠀⠀⠀⠀⠀⢸⠀⡇⠀⠀⠀│
|
||||
│⠀⠀⠀⠀⠀⠀⠀⠀⠀⠀⠀⠀⠀⠀⠀⠀⠀⠀⠀⠀⠀⠀⠀⠀⠀⠀⠹⠀⠀⠀⠀⠀⠀⠀⠘⣄⠇⠀⠀⠀│
|
||||
-50 │⠀⠀⠀⠀⠀⠀⠀⠀⠀⠀⠀⠀⠀⠀⠀⠀⠀⠀⠀⠀⠀⠀⠀⠀⠀⠀⠀⠀⠀⠀⠀⠀⠀⠀⠀⣿⠀⠀⠀⠀│
|
||||
└────────────────────────────────────────┘
|
||||
1 10
|
||||
18
test/fixtures/simple-lineplot-padding-17.txt
vendored
Normal file
18
test/fixtures/simple-lineplot-padding-17.txt
vendored
Normal file
@@ -0,0 +1,18 @@
|
||||
┌────────────────────────────────────────┐
|
||||
50 │⠀⠀⠀⠀⠀⠀⠀⠀⠀⠀⠀⠀⠀⠀⠀⠀⠀⠀⠀⠀⠀⠀⠀⠀⠀⠀⠀⠀⠀⠀⠀⠀⠀⠀⠀⠀⠀⠀⠀⢸│
|
||||
│⠀⠀⠀⠀⠀⠀⠀⠀⠀⠀⠀⠀⠀⠀⠀⠀⠀⠀⠀⠀⠀⠀⠀⠀⠀⠀⠀⠀⠀⠀⠀⡄⠀⠀⠀⠀⠀⠀⠀⡸│
|
||||
│⠀⠀⠀⠀⠀⠀⠀⠀⠀⠀⠀⠀⠀⠀⠀⠀⠀⠀⠀⠀⠀⠀⠀⠀⠀⠀⠀⠀⠀⠀⢸⢇⠀⠀⠀⠀⠀⠀⠀⡇│
|
||||
│⠀⠀⠀⠀⠀⠀⠀⠀⠀⠀⠀⠀⠀⠀⠀⠀⠀⠀⠀⠀⠀⢠⢇⠀⠀⠀⠀⠀⠀⠀⡎⢸⠀⠀⠀⠀⠀⠀⢠⠃│
|
||||
│⠀⠀⠀⠀⠀⠀⠀⠀⠀⠀⠀⠀⠀⡄⠀⠀⠀⠀⠀⠀⠀⡜⢸⠀⠀⠀⠀⠀⠀⢠⠃⠈⡆⠀⠀⠀⠀⠀⢸⠀│
|
||||
│⠀⠀⠀⠀⠀⠀⠀⠀⠀⠀⠀⠀⡸⠸⡀⠀⠀⠀⠀⠀⢠⠃⠀⡇⠀⠀⠀⠀⠀⢸⠀⠀⢇⠀⠀⠀⠀⠀⡎⠀│
|
||||
│⠀⠀⠀⡠⠳⡀⠀⠀⠀⠀⠀⢠⠃⠀⢣⠀⠀⠀⠀⠀⡜⠀⠀⢱⠀⠀⠀⠀⠀⡇⠀⠀⢸⠀⠀⠀⠀⠀⡇⠀│
|
||||
│⠤⢤⠼⠤⠤⠵⡤⠤⠤⠤⢤⠧⠤⠤⠼⡤⠤⠤⠤⢤⠧⠤⠤⠬⡦⠤⠤⠤⢴⠥⠤⠤⠬⡦⠤⠤⠤⢼⠤⠤│
|
||||
│⡠⠃⠀⠀⠀⠀⠱⡀⠀⠀⡜⠀⠀⠀⠀⢱⠀⠀⠀⡸⠀⠀⠀⠀⢣⠀⠀⠀⡸⠀⠀⠀⠀⡇⠀⠀⠀⡜⠀⠀│
|
||||
│⠁⠀⠀⠀⠀⠀⠀⠱⡀⡰⠁⠀⠀⠀⠀⠀⡇⠀⢀⠇⠀⠀⠀⠀⠸⡀⠀⠀⡇⠀⠀⠀⠀⢸⠀⠀⠀⡇⠀⠀│
|
||||
│⠀⠀⠀⠀⠀⠀⠀⠀⠱⠃⠀⠀⠀⠀⠀⠀⠸⡀⡸⠀⠀⠀⠀⠀⠀⢇⠀⢸⠀⠀⠀⠀⠀⠘⡄⠀⢰⠁⠀⠀│
|
||||
│⠀⠀⠀⠀⠀⠀⠀⠀⠀⠀⠀⠀⠀⠀⠀⠀⠀⢇⠇⠀⠀⠀⠀⠀⠀⢸⠀⡎⠀⠀⠀⠀⠀⠀⡇⠀⢸⠀⠀⠀│
|
||||
│⠀⠀⠀⠀⠀⠀⠀⠀⠀⠀⠀⠀⠀⠀⠀⠀⠀⠈⠀⠀⠀⠀⠀⠀⠀⠀⣇⠇⠀⠀⠀⠀⠀⠀⢸⠀⡇⠀⠀⠀│
|
||||
│⠀⠀⠀⠀⠀⠀⠀⠀⠀⠀⠀⠀⠀⠀⠀⠀⠀⠀⠀⠀⠀⠀⠀⠀⠀⠀⠹⠀⠀⠀⠀⠀⠀⠀⠘⣄⠇⠀⠀⠀│
|
||||
-50 │⠀⠀⠀⠀⠀⠀⠀⠀⠀⠀⠀⠀⠀⠀⠀⠀⠀⠀⠀⠀⠀⠀⠀⠀⠀⠀⠀⠀⠀⠀⠀⠀⠀⠀⠀⣿⠀⠀⠀⠀│
|
||||
└────────────────────────────────────────┘
|
||||
1 10
|
||||
18
test/fixtures/simple-lineplot-width-17.txt
vendored
Normal file
18
test/fixtures/simple-lineplot-width-17.txt
vendored
Normal file
@@ -0,0 +1,18 @@
|
||||
┌─────────────────┐
|
||||
50 │⠀⠀⠀⠀⠀⠀⠀⠀⠀⠀⠀⠀⠀⠀⠀⠀⢸│
|
||||
│⠀⠀⠀⠀⠀⠀⠀⠀⠀⠀⠀⠀⠀⡄⠀⠀⢸│
|
||||
│⠀⠀⠀⠀⠀⠀⠀⠀⠀⠀⠀⠀⠀⡇⠀⠀⢸│
|
||||
│⠀⠀⠀⠀⠀⠀⠀⠀⠀⣧⠀⠀⢸⢣⠀⠀⢸│
|
||||
│⠀⠀⠀⠀⠀⢠⠀⠀⠀⣿⠀⠀⢸⢸⠀⠀⡇│
|
||||
│⠀⠀⠀⠀⠀⣾⠀⠀⢰⢹⠀⠀⢸⢸⠀⠀⡇│
|
||||
│⠀⡸⡄⠀⢀⠇⡇⠀⢸⠈⡆⠀⡎⢸⠀⠀⡇│
|
||||
│⢤⠧⢧⠤⢼⠤⡧⠤⡼⠤⡧⠤⡧⠬⡦⠤⡧│
|
||||
│⡎⠀⠸⡀⡎⠀⢸⠀⡇⠀⡇⠀⡇⠀⡇⢸⠀│
|
||||
│⠁⠀⠀⡇⡇⠀⢸⠀⡇⠀⢸⢠⠃⠀⡇⢸⠀│
|
||||
│⠀⠀⠀⠸⠀⠀⠀⣿⠀⠀⢸⢸⠀⠀⢇⢸⠀│
|
||||
│⠀⠀⠀⠀⠀⠀⠀⣿⠀⠀⠸⣸⠀⠀⢸⢸⠀│
|
||||
│⠀⠀⠀⠀⠀⠀⠀⠈⠀⠀⠀⡟⠀⠀⢸⡇⠀│
|
||||
│⠀⠀⠀⠀⠀⠀⠀⠀⠀⠀⠀⠇⠀⠀⢸⡇⠀│
|
||||
-50 │⠀⠀⠀⠀⠀⠀⠀⠀⠀⠀⠀⠀⠀⠀⠈⡇⠀│
|
||||
└─────────────────┘
|
||||
1 10
|
||||
19
test/fixtures/simple-lineplot-xlabel.txt
vendored
Normal file
19
test/fixtures/simple-lineplot-xlabel.txt
vendored
Normal file
@@ -0,0 +1,19 @@
|
||||
┌────────────────────────────────────────┐
|
||||
50 │⠀⠀⠀⠀⠀⠀⠀⠀⠀⠀⠀⠀⠀⠀⠀⠀⠀⠀⠀⠀⠀⠀⠀⠀⠀⠀⠀⠀⠀⠀⠀⠀⠀⠀⠀⠀⠀⠀⠀⢸│
|
||||
│⠀⠀⠀⠀⠀⠀⠀⠀⠀⠀⠀⠀⠀⠀⠀⠀⠀⠀⠀⠀⠀⠀⠀⠀⠀⠀⠀⠀⠀⠀⠀⡄⠀⠀⠀⠀⠀⠀⠀⡸│
|
||||
│⠀⠀⠀⠀⠀⠀⠀⠀⠀⠀⠀⠀⠀⠀⠀⠀⠀⠀⠀⠀⠀⠀⠀⠀⠀⠀⠀⠀⠀⠀⢸⢇⠀⠀⠀⠀⠀⠀⠀⡇│
|
||||
│⠀⠀⠀⠀⠀⠀⠀⠀⠀⠀⠀⠀⠀⠀⠀⠀⠀⠀⠀⠀⠀⢠⢇⠀⠀⠀⠀⠀⠀⠀⡎⢸⠀⠀⠀⠀⠀⠀⢠⠃│
|
||||
│⠀⠀⠀⠀⠀⠀⠀⠀⠀⠀⠀⠀⠀⡄⠀⠀⠀⠀⠀⠀⠀⡜⢸⠀⠀⠀⠀⠀⠀⢠⠃⠈⡆⠀⠀⠀⠀⠀⢸⠀│
|
||||
│⠀⠀⠀⠀⠀⠀⠀⠀⠀⠀⠀⠀⡸⠸⡀⠀⠀⠀⠀⠀⢠⠃⠀⡇⠀⠀⠀⠀⠀⢸⠀⠀⢇⠀⠀⠀⠀⠀⡎⠀│
|
||||
│⠀⠀⠀⡠⠳⡀⠀⠀⠀⠀⠀⢠⠃⠀⢣⠀⠀⠀⠀⠀⡜⠀⠀⢱⠀⠀⠀⠀⠀⡇⠀⠀⢸⠀⠀⠀⠀⠀⡇⠀│
|
||||
│⠤⢤⠼⠤⠤⠵⡤⠤⠤⠤⢤⠧⠤⠤⠼⡤⠤⠤⠤⢤⠧⠤⠤⠬⡦⠤⠤⠤⢴⠥⠤⠤⠬⡦⠤⠤⠤⢼⠤⠤│
|
||||
│⡠⠃⠀⠀⠀⠀⠱⡀⠀⠀⡜⠀⠀⠀⠀⢱⠀⠀⠀⡸⠀⠀⠀⠀⢣⠀⠀⠀⡸⠀⠀⠀⠀⡇⠀⠀⠀⡜⠀⠀│
|
||||
│⠁⠀⠀⠀⠀⠀⠀⠱⡀⡰⠁⠀⠀⠀⠀⠀⡇⠀⢀⠇⠀⠀⠀⠀⠸⡀⠀⠀⡇⠀⠀⠀⠀⢸⠀⠀⠀⡇⠀⠀│
|
||||
│⠀⠀⠀⠀⠀⠀⠀⠀⠱⠃⠀⠀⠀⠀⠀⠀⠸⡀⡸⠀⠀⠀⠀⠀⠀⢇⠀⢸⠀⠀⠀⠀⠀⠘⡄⠀⢰⠁⠀⠀│
|
||||
│⠀⠀⠀⠀⠀⠀⠀⠀⠀⠀⠀⠀⠀⠀⠀⠀⠀⢇⠇⠀⠀⠀⠀⠀⠀⢸⠀⡎⠀⠀⠀⠀⠀⠀⡇⠀⢸⠀⠀⠀│
|
||||
│⠀⠀⠀⠀⠀⠀⠀⠀⠀⠀⠀⠀⠀⠀⠀⠀⠀⠈⠀⠀⠀⠀⠀⠀⠀⠀⣇⠇⠀⠀⠀⠀⠀⠀⢸⠀⡇⠀⠀⠀│
|
||||
│⠀⠀⠀⠀⠀⠀⠀⠀⠀⠀⠀⠀⠀⠀⠀⠀⠀⠀⠀⠀⠀⠀⠀⠀⠀⠀⠹⠀⠀⠀⠀⠀⠀⠀⠘⣄⠇⠀⠀⠀│
|
||||
-50 │⠀⠀⠀⠀⠀⠀⠀⠀⠀⠀⠀⠀⠀⠀⠀⠀⠀⠀⠀⠀⠀⠀⠀⠀⠀⠀⠀⠀⠀⠀⠀⠀⠀⠀⠀⣿⠀⠀⠀⠀│
|
||||
└────────────────────────────────────────┘
|
||||
1 10
|
||||
X-LABEL
|
||||
18
test/fixtures/simple-lineplot-ylabel.txt
vendored
Normal file
18
test/fixtures/simple-lineplot-ylabel.txt
vendored
Normal file
@@ -0,0 +1,18 @@
|
||||
┌────────────────────────────────────────┐
|
||||
50 │⠀⠀⠀⠀⠀⠀⠀⠀⠀⠀⠀⠀⠀⠀⠀⠀⠀⠀⠀⠀⠀⠀⠀⠀⠀⠀⠀⠀⠀⠀⠀⠀⠀⠀⠀⠀⠀⠀⠀⢸│
|
||||
│⠀⠀⠀⠀⠀⠀⠀⠀⠀⠀⠀⠀⠀⠀⠀⠀⠀⠀⠀⠀⠀⠀⠀⠀⠀⠀⠀⠀⠀⠀⠀⡄⠀⠀⠀⠀⠀⠀⠀⡸│
|
||||
│⠀⠀⠀⠀⠀⠀⠀⠀⠀⠀⠀⠀⠀⠀⠀⠀⠀⠀⠀⠀⠀⠀⠀⠀⠀⠀⠀⠀⠀⠀⢸⢇⠀⠀⠀⠀⠀⠀⠀⡇│
|
||||
│⠀⠀⠀⠀⠀⠀⠀⠀⠀⠀⠀⠀⠀⠀⠀⠀⠀⠀⠀⠀⠀⢠⢇⠀⠀⠀⠀⠀⠀⠀⡎⢸⠀⠀⠀⠀⠀⠀⢠⠃│
|
||||
│⠀⠀⠀⠀⠀⠀⠀⠀⠀⠀⠀⠀⠀⡄⠀⠀⠀⠀⠀⠀⠀⡜⢸⠀⠀⠀⠀⠀⠀⢠⠃⠈⡆⠀⠀⠀⠀⠀⢸⠀│
|
||||
│⠀⠀⠀⠀⠀⠀⠀⠀⠀⠀⠀⠀⡸⠸⡀⠀⠀⠀⠀⠀⢠⠃⠀⡇⠀⠀⠀⠀⠀⢸⠀⠀⢇⠀⠀⠀⠀⠀⡎⠀│
|
||||
│⠀⠀⠀⡠⠳⡀⠀⠀⠀⠀⠀⢠⠃⠀⢣⠀⠀⠀⠀⠀⡜⠀⠀⢱⠀⠀⠀⠀⠀⡇⠀⠀⢸⠀⠀⠀⠀⠀⡇⠀│
|
||||
Y-LABEL │⠤⢤⠼⠤⠤⠵⡤⠤⠤⠤⢤⠧⠤⠤⠼⡤⠤⠤⠤⢤⠧⠤⠤⠬⡦⠤⠤⠤⢴⠥⠤⠤⠬⡦⠤⠤⠤⢼⠤⠤│
|
||||
│⡠⠃⠀⠀⠀⠀⠱⡀⠀⠀⡜⠀⠀⠀⠀⢱⠀⠀⠀⡸⠀⠀⠀⠀⢣⠀⠀⠀⡸⠀⠀⠀⠀⡇⠀⠀⠀⡜⠀⠀│
|
||||
│⠁⠀⠀⠀⠀⠀⠀⠱⡀⡰⠁⠀⠀⠀⠀⠀⡇⠀⢀⠇⠀⠀⠀⠀⠸⡀⠀⠀⡇⠀⠀⠀⠀⢸⠀⠀⠀⡇⠀⠀│
|
||||
│⠀⠀⠀⠀⠀⠀⠀⠀⠱⠃⠀⠀⠀⠀⠀⠀⠸⡀⡸⠀⠀⠀⠀⠀⠀⢇⠀⢸⠀⠀⠀⠀⠀⠘⡄⠀⢰⠁⠀⠀│
|
||||
│⠀⠀⠀⠀⠀⠀⠀⠀⠀⠀⠀⠀⠀⠀⠀⠀⠀⢇⠇⠀⠀⠀⠀⠀⠀⢸⠀⡎⠀⠀⠀⠀⠀⠀⡇⠀⢸⠀⠀⠀│
|
||||
│⠀⠀⠀⠀⠀⠀⠀⠀⠀⠀⠀⠀⠀⠀⠀⠀⠀⠈⠀⠀⠀⠀⠀⠀⠀⠀⣇⠇⠀⠀⠀⠀⠀⠀⢸⠀⡇⠀⠀⠀│
|
||||
│⠀⠀⠀⠀⠀⠀⠀⠀⠀⠀⠀⠀⠀⠀⠀⠀⠀⠀⠀⠀⠀⠀⠀⠀⠀⠀⠹⠀⠀⠀⠀⠀⠀⠀⠘⣄⠇⠀⠀⠀│
|
||||
-50 │⠀⠀⠀⠀⠀⠀⠀⠀⠀⠀⠀⠀⠀⠀⠀⠀⠀⠀⠀⠀⠀⠀⠀⠀⠀⠀⠀⠀⠀⠀⠀⠀⠀⠀⠀⣿⠀⠀⠀⠀│
|
||||
└────────────────────────────────────────┘
|
||||
1 10
|
||||
18
test/fixtures/simple-lineplot.txt
vendored
Normal file
18
test/fixtures/simple-lineplot.txt
vendored
Normal file
@@ -0,0 +1,18 @@
|
||||
┌────────────────────────────────────────┐
|
||||
50 │⠀⠀⠀⠀⠀⠀⠀⠀⠀⠀⠀⠀⠀⠀⠀⠀⠀⠀⠀⠀⠀⠀⠀⠀⠀⠀⠀⠀⠀⠀⠀⠀⠀⠀⠀⠀⠀⠀⠀⢸│
|
||||
│⠀⠀⠀⠀⠀⠀⠀⠀⠀⠀⠀⠀⠀⠀⠀⠀⠀⠀⠀⠀⠀⠀⠀⠀⠀⠀⠀⠀⠀⠀⠀⡄⠀⠀⠀⠀⠀⠀⠀⡸│
|
||||
│⠀⠀⠀⠀⠀⠀⠀⠀⠀⠀⠀⠀⠀⠀⠀⠀⠀⠀⠀⠀⠀⠀⠀⠀⠀⠀⠀⠀⠀⠀⢸⢇⠀⠀⠀⠀⠀⠀⠀⡇│
|
||||
│⠀⠀⠀⠀⠀⠀⠀⠀⠀⠀⠀⠀⠀⠀⠀⠀⠀⠀⠀⠀⠀⢠⢇⠀⠀⠀⠀⠀⠀⠀⡎⢸⠀⠀⠀⠀⠀⠀⢠⠃│
|
||||
│⠀⠀⠀⠀⠀⠀⠀⠀⠀⠀⠀⠀⠀⡄⠀⠀⠀⠀⠀⠀⠀⡜⢸⠀⠀⠀⠀⠀⠀⢠⠃⠈⡆⠀⠀⠀⠀⠀⢸⠀│
|
||||
│⠀⠀⠀⠀⠀⠀⠀⠀⠀⠀⠀⠀⡸⠸⡀⠀⠀⠀⠀⠀⢠⠃⠀⡇⠀⠀⠀⠀⠀⢸⠀⠀⢇⠀⠀⠀⠀⠀⡎⠀│
|
||||
│⠀⠀⠀⡠⠳⡀⠀⠀⠀⠀⠀⢠⠃⠀⢣⠀⠀⠀⠀⠀⡜⠀⠀⢱⠀⠀⠀⠀⠀⡇⠀⠀⢸⠀⠀⠀⠀⠀⡇⠀│
|
||||
│⠤⢤⠼⠤⠤⠵⡤⠤⠤⠤⢤⠧⠤⠤⠼⡤⠤⠤⠤⢤⠧⠤⠤⠬⡦⠤⠤⠤⢴⠥⠤⠤⠬⡦⠤⠤⠤⢼⠤⠤│
|
||||
│⡠⠃⠀⠀⠀⠀⠱⡀⠀⠀⡜⠀⠀⠀⠀⢱⠀⠀⠀⡸⠀⠀⠀⠀⢣⠀⠀⠀⡸⠀⠀⠀⠀⡇⠀⠀⠀⡜⠀⠀│
|
||||
│⠁⠀⠀⠀⠀⠀⠀⠱⡀⡰⠁⠀⠀⠀⠀⠀⡇⠀⢀⠇⠀⠀⠀⠀⠸⡀⠀⠀⡇⠀⠀⠀⠀⢸⠀⠀⠀⡇⠀⠀│
|
||||
│⠀⠀⠀⠀⠀⠀⠀⠀⠱⠃⠀⠀⠀⠀⠀⠀⠸⡀⡸⠀⠀⠀⠀⠀⠀⢇⠀⢸⠀⠀⠀⠀⠀⠘⡄⠀⢰⠁⠀⠀│
|
||||
│⠀⠀⠀⠀⠀⠀⠀⠀⠀⠀⠀⠀⠀⠀⠀⠀⠀⢇⠇⠀⠀⠀⠀⠀⠀⢸⠀⡎⠀⠀⠀⠀⠀⠀⡇⠀⢸⠀⠀⠀│
|
||||
│⠀⠀⠀⠀⠀⠀⠀⠀⠀⠀⠀⠀⠀⠀⠀⠀⠀⠈⠀⠀⠀⠀⠀⠀⠀⠀⣇⠇⠀⠀⠀⠀⠀⠀⢸⠀⡇⠀⠀⠀│
|
||||
│⠀⠀⠀⠀⠀⠀⠀⠀⠀⠀⠀⠀⠀⠀⠀⠀⠀⠀⠀⠀⠀⠀⠀⠀⠀⠀⠹⠀⠀⠀⠀⠀⠀⠀⠘⣄⠇⠀⠀⠀│
|
||||
-50 │⠀⠀⠀⠀⠀⠀⠀⠀⠀⠀⠀⠀⠀⠀⠀⠀⠀⠀⠀⠀⠀⠀⠀⠀⠀⠀⠀⠀⠀⠀⠀⠀⠀⠀⠀⣿⠀⠀⠀⠀│
|
||||
└────────────────────────────────────────┘
|
||||
1 10
|
||||
10
test/fixtures/simple.tsv
vendored
Normal file
10
test/fixtures/simple.tsv
vendored
Normal file
@@ -0,0 +1,10 @@
|
||||
-10
|
||||
10
|
||||
-20
|
||||
20
|
||||
-30
|
||||
30
|
||||
-40
|
||||
40
|
||||
-50
|
||||
50
|
||||
|
1
test/fixtures/simpleT.tsv
vendored
Normal file
1
test/fixtures/simpleT.tsv
vendored
Normal file
@@ -0,0 +1 @@
|
||||
-10 10 -20 20 -30 30 -40 40 -50 50
|
||||
|
@@ -8,4 +8,10 @@ class YouPlotCommandTest < Test::Unit::TestCase
|
||||
assert_equal([%i[a b c], [3, 2, 1]], @m.count_values(%i[a a a b b c]))
|
||||
assert_equal([%i[c b a], [3, 2, 1]], @m.count_values(%i[a b b c c c]))
|
||||
end
|
||||
|
||||
test :count_values_non_tally do
|
||||
@m = YouPlot::Backends::Processing
|
||||
assert_equal([%i[a b c], [3, 2, 1]], @m.count_values(%i[a a a b b c], tally: false))
|
||||
assert_equal([%i[c b a], [3, 2, 1]], @m.count_values(%i[a b b c c c], tally: false))
|
||||
end
|
||||
end
|
||||
|
||||
@@ -2,9 +2,9 @@
|
||||
|
||||
require_relative '../test_helper'
|
||||
|
||||
class YouPlotDSVReaderTest < Test::Unit::TestCase
|
||||
class YouPlotDSVTest < Test::Unit::TestCase
|
||||
def setup
|
||||
@m = YouPlot::DSVReader
|
||||
@m = YouPlot::DSV
|
||||
end
|
||||
|
||||
test :transpose2 do
|
||||
@@ -59,6 +59,8 @@ class YouPlotDSVReaderTest < Test::Unit::TestCase
|
||||
assert_equal(nil, @m.get_headers([[1, 2, 3],
|
||||
[4, 5, 6],
|
||||
[7, 8, 9]], false, false))
|
||||
|
||||
assert_equal([1, 2, 3], @m.get_headers([[1, 2, 3]], true, false))
|
||||
end
|
||||
|
||||
test :get_series do
|
||||
@@ -123,5 +125,7 @@ class YouPlotDSVReaderTest < Test::Unit::TestCase
|
||||
[n, n, 6]], @m.get_series([[1],
|
||||
[2, 4],
|
||||
[3, 5, 6]], false, false))
|
||||
|
||||
assert_equal([[], [], []], @m.get_series([[1, 2, 3]], true, false))
|
||||
end
|
||||
end
|
||||
@@ -3,7 +3,7 @@
|
||||
require 'tempfile'
|
||||
require_relative '../test_helper'
|
||||
|
||||
class YouPlotCommandTest < Test::Unit::TestCase
|
||||
class YouPlotIRISTest < Test::Unit::TestCase
|
||||
class << self
|
||||
def startup
|
||||
@stdin = $stdin.dup
|
||||
@@ -104,15 +104,26 @@ class YouPlotCommandTest < Test::Unit::TestCase
|
||||
assert_equal fixture('iris-boxplot.txt'), @stderr_file.read
|
||||
end
|
||||
|
||||
# test :c do
|
||||
# YouPlot::Command.new(['count', '-H', '-d,']).run
|
||||
# assert_equal fixture('iris-count.txt'), @stderr_file.read
|
||||
# end
|
||||
|
||||
# test :count do
|
||||
# YouPlot::Command.new(['c', '-H', '-d,']).run
|
||||
# assert_equal fixture('iris-count.txt'), @stderr_file.read
|
||||
# end
|
||||
|
||||
test :plot_output_stdout do
|
||||
YouPlot::Command.new(['bar', '-o', '-H', '-d,', '-t', 'IRIS-BARPLOT']).run
|
||||
assert_equal '', @stderr_file.read
|
||||
assert_equal fixture('iris-barplot.txt'), @stdout_file.read
|
||||
end
|
||||
|
||||
test :data_output_stdout do
|
||||
YouPlot::Command.new(['bar', '-O', '-H', '-d,', '-t', 'IRIS-BARPLOT']).run
|
||||
assert_equal fixture('iris-barplot.txt'), @stderr_file.read
|
||||
assert_equal File.read(File.expand_path('../fixtures/iris.csv', __dir__)), @stdout_file.read
|
||||
assert_equal fixture('iris.csv'), @stdout_file.read
|
||||
end
|
||||
|
||||
%i[colors color colours colour].each do |cmd_name|
|
||||
@@ -128,4 +139,18 @@ class YouPlotCommandTest < Test::Unit::TestCase
|
||||
assert_equal '', @stderr_file.read
|
||||
assert_equal fixture('colors.txt'), @stdout_file.read
|
||||
end
|
||||
|
||||
test :unrecognized_command do
|
||||
assert_raise(YouPlot::Command::Parser::Error) do
|
||||
YouPlot::Command.new(['abracadabra', '--hadley', '--wickham']).run
|
||||
end
|
||||
assert_equal '', @stderr_file.read
|
||||
assert_equal '', @stdout_file.read
|
||||
end
|
||||
|
||||
test :encoding do
|
||||
$stdin = File.open(File.expand_path('../fixtures/iris_utf16.csv', __dir__), 'r')
|
||||
YouPlot::Command.new(['s', '--encoding', 'UTF-16', '-H', '-d,', '-t', 'IRIS-SCATTER']).run
|
||||
assert_equal fixture('iris-scatter.txt'), @stderr_file.read
|
||||
end
|
||||
end
|
||||
205
test/youplot/simple_test.rb
Normal file
205
test/youplot/simple_test.rb
Normal file
@@ -0,0 +1,205 @@
|
||||
# frozen_string_literal: true
|
||||
|
||||
require 'tempfile'
|
||||
require_relative '../test_helper'
|
||||
|
||||
class YouPlotSimpleTest < Test::Unit::TestCase
|
||||
class << self
|
||||
def startup
|
||||
@stdin = $stdin.dup
|
||||
@stdout = $stdout.dup
|
||||
@stderr = $stderr.dup
|
||||
end
|
||||
|
||||
def shutdown
|
||||
$stdin = @stdin
|
||||
$stdout = @stdout
|
||||
$stderr = @stderr
|
||||
end
|
||||
end
|
||||
|
||||
def setup
|
||||
$stdin = File.open(File.expand_path('../fixtures/simple.tsv', __dir__), 'r')
|
||||
@stderr_file = Tempfile.new
|
||||
@stdout_file = Tempfile.new
|
||||
$stderr = @stderr_file
|
||||
$stdout = @stdout_file
|
||||
end
|
||||
|
||||
def teardown
|
||||
@stderr_file.close
|
||||
end
|
||||
|
||||
def fixture(fname)
|
||||
File.read(File.expand_path("../fixtures/#{fname}", __dir__))
|
||||
end
|
||||
|
||||
test :bar do
|
||||
assert_raise(ArgumentError) do
|
||||
YouPlot::Command.new(['bar']).run
|
||||
end
|
||||
end
|
||||
|
||||
test :barplot do
|
||||
assert_raise(ArgumentError) do
|
||||
YouPlot::Command.new(['barplot']).run
|
||||
end
|
||||
end
|
||||
|
||||
test :hist do
|
||||
YouPlot::Command.new(['hist']).run
|
||||
assert_equal fixture('simple-histogram.txt'), @stderr_file.read
|
||||
end
|
||||
|
||||
test :histogram do
|
||||
YouPlot::Command.new(['histogram']).run
|
||||
assert_equal fixture('simple-histogram.txt'), @stderr_file.read
|
||||
end
|
||||
|
||||
test :line do
|
||||
YouPlot::Command.new(['line']).run
|
||||
assert_equal fixture('simple-lineplot.txt'), @stderr_file.read
|
||||
end
|
||||
|
||||
test :lineplot do
|
||||
YouPlot::Command.new(['lineplot']).run
|
||||
assert_equal fixture('simple-lineplot.txt'), @stderr_file.read
|
||||
end
|
||||
|
||||
test :lines do
|
||||
assert_raise(YouPlot::Backends::UnicodePlotBackend::Error) do
|
||||
YouPlot::Command.new(['lines']).run
|
||||
end
|
||||
end
|
||||
|
||||
test :lineplots do
|
||||
assert_raise(YouPlot::Backends::UnicodePlotBackend::Error) do
|
||||
YouPlot::Command.new(['lineplots']).run
|
||||
end
|
||||
end
|
||||
|
||||
test :s do
|
||||
assert_raise(YouPlot::Backends::UnicodePlotBackend::Error) do
|
||||
YouPlot::Command.new(['s']).run
|
||||
end
|
||||
end
|
||||
|
||||
test :scatter do
|
||||
assert_raise(YouPlot::Backends::UnicodePlotBackend::Error) do
|
||||
YouPlot::Command.new(['scatter']).run
|
||||
end
|
||||
end
|
||||
|
||||
test :d do
|
||||
assert_raise(YouPlot::Backends::UnicodePlotBackend::Error) do
|
||||
YouPlot::Command.new(['d']).run
|
||||
end
|
||||
end
|
||||
|
||||
test :density do
|
||||
assert_raise(YouPlot::Backends::UnicodePlotBackend::Error) do
|
||||
YouPlot::Command.new(['density']).run
|
||||
end
|
||||
end
|
||||
|
||||
test :box do
|
||||
YouPlot::Command.new(['box']).run
|
||||
assert_equal fixture('simple-boxplot.txt'), @stderr_file.read
|
||||
end
|
||||
|
||||
test :boxplot do
|
||||
YouPlot::Command.new(['boxplot']).run
|
||||
assert_equal fixture('simple-boxplot.txt'), @stderr_file.read
|
||||
end
|
||||
|
||||
# test :c do
|
||||
# omit
|
||||
# YouPlot::Command.new(['count', '-H', '-d,']).run
|
||||
# assert_equal fixture('iris-count.txt'), @stderr_file.read
|
||||
# end
|
||||
|
||||
# test :count do
|
||||
# omit
|
||||
# YouPlot::Command.new(['c', '-H', '-d,']).run
|
||||
# assert_equal fixture('iris-count.txt'), @stderr_file.read
|
||||
# end
|
||||
|
||||
test :plot_output_stdout do
|
||||
YouPlot::Command.new(['line', '-o']).run
|
||||
assert_equal '', @stderr_file.read
|
||||
assert_equal fixture('simple-lineplot.txt'), @stdout_file.read
|
||||
end
|
||||
|
||||
test :data_output_stdout do
|
||||
YouPlot::Command.new(['box', '-O']).run
|
||||
assert_equal fixture('simple-boxplot.txt'), @stderr_file.read
|
||||
assert_equal fixture('simple.tsv'), @stdout_file.read
|
||||
end
|
||||
|
||||
test :line_transpose do
|
||||
$stdin = File.open(File.expand_path('../fixtures/simpleT.tsv', __dir__), 'r')
|
||||
YouPlot::Command.new(['line', '--transpose']).run
|
||||
assert_equal fixture('simple-lineplot.txt'), @stderr_file.read
|
||||
end
|
||||
|
||||
test :line_T do
|
||||
$stdin = File.open(File.expand_path('../fixtures/simpleT.tsv', __dir__), 'r')
|
||||
YouPlot::Command.new(['line', '-T']).run
|
||||
assert_equal fixture('simple-lineplot.txt'), @stderr_file.read
|
||||
end
|
||||
|
||||
test :line_xlabel do
|
||||
YouPlot::Command.new(['line', '--xlabel', 'X-LABEL']).run
|
||||
assert_equal fixture('simple-lineplot-xlabel.txt'), @stderr_file.read
|
||||
end
|
||||
|
||||
test :line_x do
|
||||
YouPlot::Command.new(['line', '-x', 'X-LABEL']).run
|
||||
assert_equal fixture('simple-lineplot-xlabel.txt'), @stderr_file.read
|
||||
end
|
||||
|
||||
test :line_ylabel do
|
||||
YouPlot::Command.new(['line', '--ylabel', 'Y-LABEL']).run
|
||||
assert_equal fixture('simple-lineplot-ylabel.txt'), @stderr_file.read
|
||||
end
|
||||
|
||||
test :line_y do
|
||||
YouPlot::Command.new(['line', '-y', 'Y-LABEL']).run
|
||||
assert_equal fixture('simple-lineplot-ylabel.txt'), @stderr_file.read
|
||||
end
|
||||
|
||||
test :line_width do
|
||||
YouPlot::Command.new(['line', '--width', '17']).run
|
||||
assert_equal fixture('simple-lineplot-width-17.txt'), @stderr_file.read
|
||||
end
|
||||
|
||||
test :line_w do
|
||||
YouPlot::Command.new(['line', '--w', '17']).run
|
||||
assert_equal fixture('simple-lineplot-width-17.txt'), @stderr_file.read
|
||||
end
|
||||
|
||||
test :line_height do
|
||||
YouPlot::Command.new(['line', '--height', '17']).run
|
||||
assert_equal fixture('simple-lineplot-height-17.txt'), @stderr_file.read
|
||||
end
|
||||
|
||||
test :line_h do
|
||||
YouPlot::Command.new(['line', '--height', '17']).run
|
||||
assert_equal fixture('simple-lineplot-height-17.txt'), @stderr_file.read
|
||||
end
|
||||
|
||||
test :line_margin do
|
||||
YouPlot::Command.new(['line', '--margin', '17']).run
|
||||
assert_equal fixture('simple-lineplot-margin-17.txt'), @stderr_file.read
|
||||
end
|
||||
|
||||
test :line_m do
|
||||
YouPlot::Command.new(['line', '--m', '17']).run
|
||||
assert_equal fixture('simple-lineplot-margin-17.txt'), @stderr_file.read
|
||||
end
|
||||
|
||||
test :line_padding do
|
||||
YouPlot::Command.new(['line', '--padding', '17']).run
|
||||
assert_equal fixture('simple-lineplot-padding-17.txt'), @stderr_file.read
|
||||
end
|
||||
end
|
||||
@@ -3,7 +3,19 @@
|
||||
require_relative 'test_helper'
|
||||
|
||||
class YouPlotTest < Test::Unit::TestCase
|
||||
def test_that_it_has_a_version_number
|
||||
def teardown
|
||||
YouPlot.run_as_executable = false
|
||||
end
|
||||
|
||||
test :it_has_a_version_number do
|
||||
assert_kind_of String, ::YouPlot::VERSION
|
||||
end
|
||||
|
||||
test :run_as_executable do
|
||||
assert_equal false, YouPlot.run_as_executable
|
||||
assert_equal false, YouPlot.run_as_executable?
|
||||
YouPlot.run_as_executable = true
|
||||
assert_equal true, YouPlot.run_as_executable
|
||||
assert_equal true, YouPlot.run_as_executable?
|
||||
end
|
||||
end
|
||||
|
||||
@@ -8,18 +8,15 @@ Gem::Specification.new do |spec|
|
||||
spec.authors = ['kojix2']
|
||||
spec.email = ['2xijok@gmail.com']
|
||||
|
||||
spec.summary = 'Create Ascii charts on your terminal.'
|
||||
spec.description = <<~MSG
|
||||
Create ASCII charts on the terminal with data from standard streams in the
|
||||
pipeline.
|
||||
MSG
|
||||
spec.summary = 'A command line tool for Unicode Plotting'
|
||||
spec.description = 'A command line tool for Unicode Plotting'
|
||||
spec.homepage = 'https://github.com/kojix2/youplot'
|
||||
spec.license = 'MIT'
|
||||
spec.required_ruby_version = Gem::Requirement.new('>= 2.4.0')
|
||||
|
||||
spec.files = Dir['*.{md,txt}', '{lib,exe}/**/*']
|
||||
spec.bindir = 'exe'
|
||||
spec.executables = ['uplot', 'youplot']
|
||||
spec.executables = %w[uplot youplot]
|
||||
spec.require_paths = ['lib']
|
||||
|
||||
spec.add_runtime_dependency 'unicode_plot'
|
||||
|
||||
Reference in New Issue
Block a user