mirror of
https://github.com/red-data-tools/YouPlot.git
synced 2025-05-06 07:10:10 +08:00
200 lines
6.3 KiB
Markdown
200 lines
6.3 KiB
Markdown

|
|
|
|

|
|
[](https://badge.fury.io/rb/youplot)
|
|
[](https://rubydoc.info/gems/youplot)
|
|
[](LICENSE.txt)
|
|
[](https://zenodo.org/badge/latestdoi/283230219)
|
|
|
|
YouPlot is a command line tool for Unicode Plotting working with data from standard stream.
|
|
|
|
:bar_chart: Powered by [UnicodePlot](https://github.com/red-data-tools/unicode_plot.rb)
|
|
|
|
## Installation
|
|
|
|
```
|
|
gem install youplot
|
|
```
|
|
|
|
## Quick Start
|
|
|
|
`cat data.tsv | uplot <command> [options]`
|
|
|
|
### barplot
|
|
|
|
```sh
|
|
curl -sL https://git.io/ISLANDScsv \
|
|
| sort -nk2 -t, \
|
|
| tail \
|
|
| uplot bar -d, -t "Areas of the World's Major Landmasses"
|
|
```
|
|
|
|

|
|
|
|
### histogram
|
|
|
|
```sh
|
|
echo -e "from numpy import random;" \
|
|
"n = random.randn(10000);" \
|
|
"print('\\\n'.join(str(i) for i in n))" \
|
|
| python \
|
|
| uplot hist --nbins 20
|
|
```
|
|

|
|
|
|
### lineplot
|
|
|
|
```sh
|
|
curl -sL https://git.io/AirPassengers \
|
|
| cut -f2,3 -d, \
|
|
| uplot line -d, -w 50 -h 15 -t AirPassengers --xlim 1950,1960 --ylim 0,600
|
|
```
|
|
|
|

|
|
|
|
### scatter
|
|
|
|
```sh
|
|
curl -sL https://git.io/IRIStsv \
|
|
| cut -f1-4 \
|
|
| uplot scatter -H -t IRIS
|
|
```
|
|
|
|

|
|
|
|
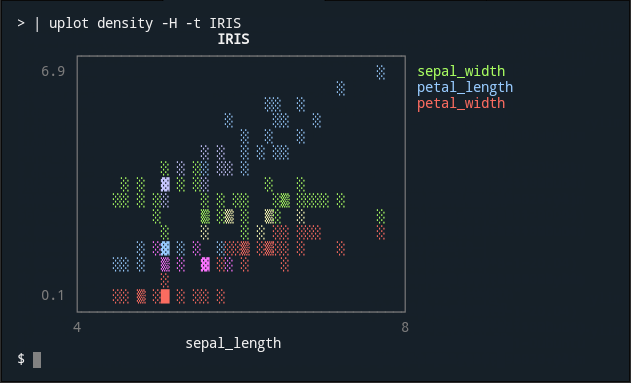
### density
|
|
|
|
```sh
|
|
curl -sL https://git.io/IRIStsv \
|
|
| cut -f1-4 \
|
|
| uplot density -H -t IRIS
|
|
```
|
|
|
|
|
|
|
|
### boxplot
|
|
|
|
```sh
|
|
curl -sL https://git.io/IRIStsv \
|
|
| cut -f1-4 \
|
|
| uplot boxplot -H -t IRIS
|
|
```
|
|
|
|

|
|
|
|
### count
|
|
|
|
In this example, YouPlot counts the number of chromosomes where the gene is located from the human gene annotation file and create a bar chart. The human gene annotation file can be downloaded from the following website.
|
|
|
|
* https://www.gencodegenes.org/human/
|
|
|
|
```sh
|
|
cat gencode.v35.annotation.gff3 \
|
|
| grep -v '#' | grep 'gene' | cut -f1 | \
|
|
uplot count -t "The number of human gene annotations per chromosome" -c blue
|
|
```
|
|
|
|

|
|
|
|
Note: `count` is not very fast because it runs in a Ruby script.
|
|
This is fine if the data is small, that is, in most cases. However, if you want to visualize huge data, it is faster to use a combination of common Unix commands as shown below.
|
|
|
|
```sh
|
|
cat gencode.v35.annotation.gff3 | grep -v '#' | grep 'gene' | cut -f1 \
|
|
|sort | uniq -c | sort -nrk2 | awk '{print $2,$1}' \
|
|
| uplot bar -d ' ' -t "The number of human gene annotations per chromosome" -c blue
|
|
```
|
|
|
|
## Usage
|
|
|
|
### Why YouPlot?
|
|
|
|
Wouldn't it be a bit of pain to have to run R, Python, Julia, gnuplot or whatever REPL just to check your data?
|
|
YouPlot is a command line tool for this purpose. With YouPlot, you can continue working without leaving your terminal and shell.
|
|
|
|
### how to use YouPlot?
|
|
|
|
`uplot` is the shortened form of `youplot`. You can use either.
|
|
|
|
| | |
|
|
|-----------------------------------|------------------------------------------------|
|
|
| Reads data from standard input | `cat data.tsv \| uplot <command> [options]` |
|
|
| Reads data from files | `uplot <command> [options] data.tsv ...` |
|
|
| Outputs data from stdin to stdout | `pipeline1 \| uplot <command> -O \| pipeline2` |
|
|
|
|
### Where to output the plot?
|
|
|
|
By default, the plot is output to *standard error output*.
|
|
The output file or stream for the plot can be specified with the `-o` option.
|
|
|
|
### Where to output the input data?
|
|
|
|
By default, the input data is not output anywhere.
|
|
The `-O` option, with no arguments, outputs the input data directly to the standard output. This is useful when passing data to a subsequent pipeline.
|
|
|
|
### What types of plots are available?
|
|
|
|
The following sub-commands are available
|
|
|
|
| command | short | how it works |
|
|
|-----------|-------|----------------------------------------|
|
|
| barplot | bar | draw a horizontal barplot |
|
|
| histogram | hist | draw a horizontal histogram |
|
|
| lineplot | line | draw a line chart |
|
|
| lineplots | lines | draw a line chart with multiple series |
|
|
| scatter | s | draw a scatter plot |
|
|
| density | d | draw a density plot |
|
|
| boxplot | box | draw a horizontal boxplot |
|
|
|
|
See Quick Start for `count`.
|
|
|
|
| command | short | how it works |
|
|
|-----------|-------|----------------------------------------------------------|
|
|
| count | c | draw a baplot based on the number of occurrences (slow) |
|
|
|
|
### How to view detailed command line options
|
|
|
|
Use `--help` to print command-specific options.
|
|
|
|
`uplot hist --help`
|
|
|
|
```
|
|
Usage: uplot histogram [options] <in.tsv>
|
|
|
|
Options for histogram:
|
|
--symbol VAL character to be used to plot the bars
|
|
--closed VAL
|
|
-n, --nbins VAL approximate number of bins
|
|
|
|
Options:
|
|
...
|
|
```
|
|
|
|
### How to view the list of available colors?
|
|
|
|
```sh
|
|
uplot colors
|
|
```
|
|
|
|
## Contributing
|
|
|
|
* [Report bugs](https://github.com/kojix2/youplot/issues)
|
|
* Fix bugs and [submit pull requests](https://github.com/kojix2/youplot/pulls)
|
|
* Write, clarify, or fix documentation
|
|
* Suggest or add new features
|
|
|
|
|
|
### Development
|
|
|
|
```sh
|
|
git clone https://github.com/your_name/GR.rb # Clone the Git repo
|
|
cd GR.rb
|
|
bundle install # Install the gem dependencies
|
|
bundle exec rake test # Run the test
|
|
bundle exec rake install # Installation from source code
|
|
```
|
|
|
|
## License
|
|
|
|
[MIT License](https://opensource.org/licenses/MIT).
|