8.9 KiB
Installation
gem install youplot
Quick Start


uplot <command> [options] <data.tsv>
barplot
curl -sL https://git.io/ISLANDScsv \
| sort -nk2 -t, \
| tail -n15 \
| uplot bar -d, -t "Areas of the World's Major Landmasses"
histogram
echo -e "from numpy import random;" \
        "n = random.randn(10000);"  \
        "print('\\\n'.join(str(i) for i in n))" \
| python \
| uplot hist --nbins 20
lineplot
curl -sL https://git.io/AirPassengers \
| cut -f2,3 -d, \
| uplot line -d, -w 50 -h 15 -t AirPassengers --xlim 1950,1960 --ylim 0,600

scatter
curl -sL https://git.io/IRIStsv \
| cut -f1-4 \
| uplot scatter -H -t IRIS
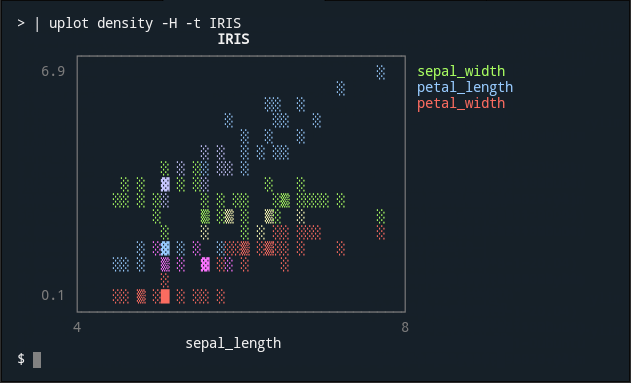
density
curl -sL https://git.io/IRIStsv \
| cut -f1-4 \
| uplot density -H -t IRIS
boxplot
curl -sL https://git.io/IRIStsv \
| cut -f1-4 \
| uplot boxplot -H -t IRIS
count
cat gencode.v35.annotation.gff3 \
| grep -v '#' | grep 'gene' | cut -f1 \
| uplot count -t "The number of human gene annotations per chromosome"  -c blue

In this example, YouPlot counts the number of chromosomes where genes are located.
Note: count is not very fast because it runs in a Ruby script.
This is fine in most cases, as long as the data size is small. If you want to visualize huge data, it is faster to use a combination of common Unix commands as shown below.
cat gencode.v35.annotation.gff3 | grep -v '#' | grep 'gene' | cut -f1 \
| sort | uniq -c | sort -nrk1 \
| uplot bar --fmt yx -d ' ' -t "The number of human gene annotations per chromosome"  -c blue
Usage
Commands
uplot is the shortened form of youplot. You can use either.
| Command | Description |
|---|---|
cat data.tsv | uplot <command> [options] |
Take input from stdin |
uplot <command> [options] data.tsv ... |
Take input from files |
pipeline1 | uplot <command> -O | pipeline2 |
Outputs data from stdin to stdout |
Subcommands
The following sub-commands are available.
| command | short | how it works |
|---|---|---|
| barplot | bar | draw a horizontal barplot |
| histogram | hist | draw a horizontal histogram |
| lineplot | line | draw a line chart |
| lineplots | lines | draw a line chart with multiple series |
| scatter | s | draw a scatter plot |
| density | d | draw a density plot |
| boxplot | box | draw a horizontal boxplot |
| count | c | draw a barplot based on the number of occurrences (slow) |
| colors | color | show the list of available colors |
Output the plot
-o- By default, the plot is output to standard error output.
- If you want to output to standard input, Use hyphen
-o -or no argumentuplot s -o |.
Output the input data
-O- By default, the input data is not shown anywhere.
- If you want to pass the input data directly to the standard output, Use hyphen
-O -or no argumentuplot s -O |. - This is useful when passing data to a subsequent pipeline.
Header
-H- If input data contains a header line, you need to specify the
-Hoption.
- If input data contains a header line, you need to specify the
Delimiter
-d- You do not need to use
-doption for tab-delimited text since the default value is tab. - To specify a blank space, you can use
uplot bar -d ' ' data.txt.
- You do not need to use
Real-time data
-p--progress- Experimental progressive mode is currently under development.
ruby -e 'loop{puts rand(100)}' | uplot line --progress
Show detailed options for subcommands
--help- The
--helpoption will show more detailed options for each subcommand. uplot hist --help
- The
Set columns as x-axis or y-axis?
-
YouPlot treats the first column as the X axis and the second column as the Y axis. When working with multiple series, the first column is the X axis, the second column is series Y1, the third column is series Y2, and so on.
-
If you pass only one column of data for
lineandbar, YouPlot will automatically use a sequential number starting from 1 as the X-axis. -
--fmt--fmt xyy--fmt xyxy--fmt yxoptions give you a few more choices. Seeyouplot <command> --helpfor more details.- The fmt option may be renamed in the future.
- The
-xand-yoptions might be used to specify columns in the future.
-
Use
awk '{print $2, $1}'to swap columns. Usepasteto concatenate series.
Categorical data
- With gne datamash, you can manage to handle categorized data.
cat test/fixtures/iris.csv | sed '/^$/d' | datamash --header-in --output-delimiter=: -t, -g5 collapse 3,4 | cut -f2-3 -d: | sed 's/:/\n/g' | uplot s -d, -T --fmt xyxy- This is not so easy...
Time series
- Not yet supported.
Tools that are useful to use with YouPlot
Contributing
YouPlot is a library under development, so even small improvements like typofix are welcome! Please feel free to send us your pull requests.
- Report bugs
- Fix bugs and submit pull requests
- Write, clarify, or fix documentation
- English corrections by native speakers are welcome.
- Suggest or add new features
- Make a donation
Development
# fork the main repository by clicking the Fork button.
git clone https://github.com/your_name/YouPlot
bundle install             # Install the gem dependencies
bundle exec rake test      # Run the test
bundle exec rake install   # Installation from source code
bundle exec exe/uplot      # Run youplot (Try out the edited code)
Acknowledgements
- sampo grafiikka - Project logo creation
- yutaas - English proofreading