Metal Debugger#
Profiling is a key step for performance optimization. You can build MLX with
the MLX_METAL_DEBUG option to improve the Metal debugging and optimization
workflow. The MLX_METAL_DEBUG debug option:
Records source during Metal compilation, for later inspection while debugging.
Labels Metal objects such as command queues, improving capture readability.
The metal::start_capture function initiates a capture of all MLX GPU work.
int main() {
    metal::start_capture("/Users/Jane/Developer/MLX.gputrace");

    auto a = arange(10.f, 20.f, 1.f, float32);
    auto b = arange(30.f, 40.f, 1.f, float32);
    auto c = add(a, b);

    eval(c);

    metal::stop_capture();
}
You can open and replay the GPU trace in Xcode. The Dependencies view
has a great overview of all operations. Checkout the Metal debugger
documentation for more information.

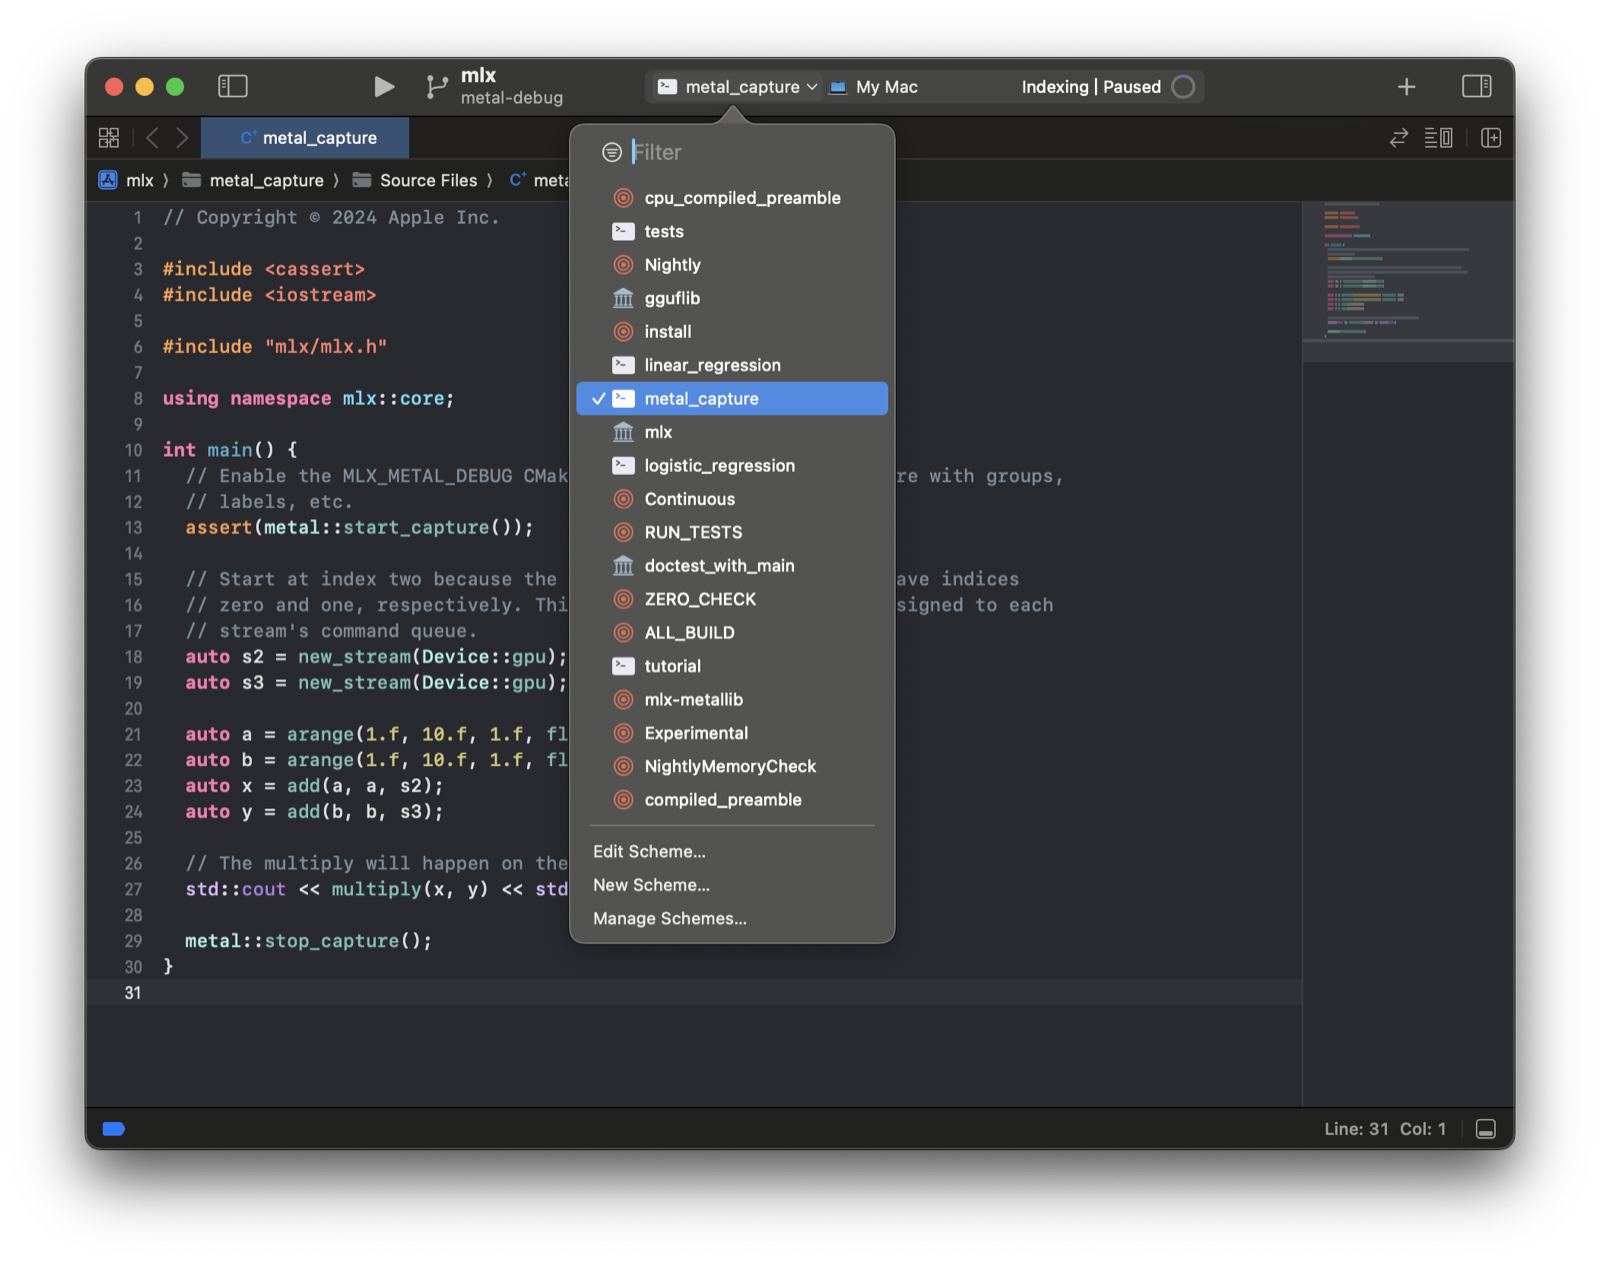
Xcode Workflow#
You can skip saving to a path by running within Xcode. First, generate an Xcode project using CMake.
mkdir build && cd build
cmake .. -DMLX_METAL_DEBUG=ON -G Xcode
open mlx.xcodeproj
Select the metal_capture example schema and run.